

Ultimaps
Ultimaps · Image
Ultimaps is a browser-based custom map maker that turns spreadsheets or AI prompts into color-coded, embeddable data maps, no GIS skills needed.
About Ultimaps
What Is Ultimaps
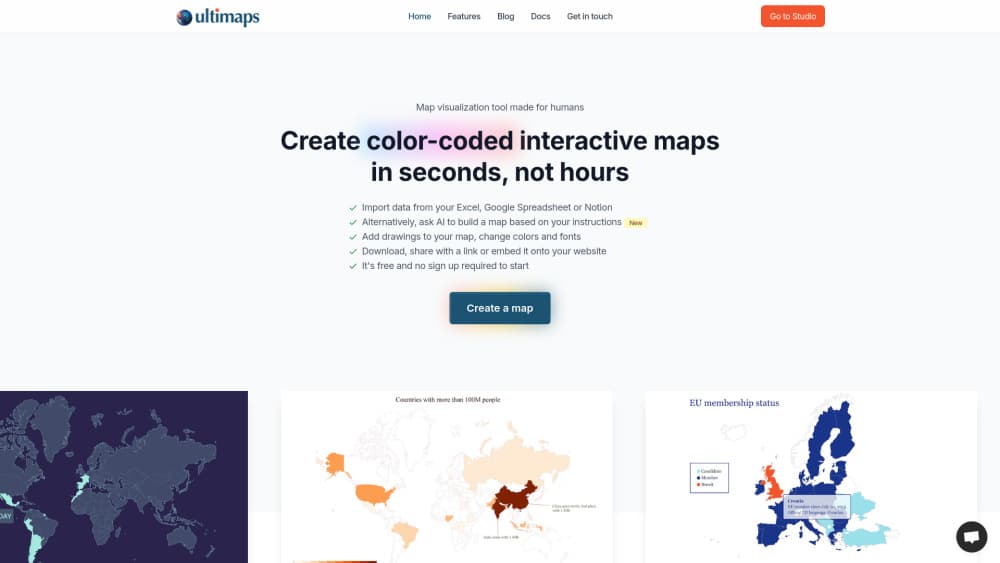
Ultimaps is a browser-based custom map maker and data visualization tool for turning region-based data into clean, color-coded maps. You bring a spreadsheet, a CSV, or even a plain sentence, and the tool fills in the regions for you. Sales teams map territories, analysts map survey results, and researchers map demographics. If your data has a place attached to it, this is where it becomes a picture people actually understand.
The problem it solves is dull but real. Standard spreadsheet charts can't show "how does this metric vary across regions." Full GIS software is overkill when all you want is a shaded county map with a legend. Ultimaps sits in that gap. It offers 200+ vector maps, and it handles the tedious part, matching your messy column names to the right regions, so you don't have to clean your file first. You can also color-code map regions by hand when you have no data file at all.
Where it draws a line is depth. It isn't a geographic information system. You won't get street-level tiles, satellite imagery, or custom projections the way you would with Google Maps or Mapbox. It also isn't free for everything. So what costs money? Exports at standard resolution and shared maps come with the free plan, but high-resolution PNG, SVG, and PDF files don't.
Getting Started
- Open Ultimaps Studio in your browser. You can start coloring without an account. Saving or embedding maps does require one.
- Pick a map from the library, covering continents by country, major countries by region, and all 50 US states by county.
- Add your data. Paste from Excel, import a CSV, connect a Google Sheet or Notion database, or just type a prompt like "color states by population."
- Customize colors, legends, and labels, then export as PNG, or publish an interactive map with tooltips and click-through links.
- Share the map by link or embed it on any website with a single line of code.
Product Information
A quick look at Ultimaps's pricing, supported platforms, and performance.
Best for
The users, tasks, and scenarios where this tool fits best.
Users
- Sales and marketing teams
- Data analysts and researchers
- Real estate and portfolio managers
- Educators and journalists
Tasks
- Coloring maps by hand
- Building sales territory maps
- Creating interactive embeds
- Commissioning a custom map
Scenarios
- Quarterly territory reviews
- Investor and client reports
- Classroom geography lessons
- Website location finders
Key features
AI Prompt to Map
Instead of formatting a file, you can describe what you want in plain language, like "color states by population." Ultimaps reads the prompt, matches it to the right regions, and generates the map. It's the fastest path when your data lives in your head rather than a spreadsheet, and it sits alongside the manual import options rather than replacing them.
Spreadsheet and Database Import
You can paste from Excel, upload a CSV, connect a Google Sheet, or pull from a Notion database. The tool matches your data to the correct regions automatically, even when your formatting is messy. That matters. Anyone who has spent an afternoon cleaning column headers before a chart tool would cooperate will recognize why.
200+ Ready-Made Vector Maps
The library covers every continent divided by country, major countries split into administrative regions (states, provinces, departments), and all 50 US states divided by county. Because the maps are vector, they stay sharp at any size. If your region isn't there, the team builds custom ones.
High-Resolution and Vector Exports
Free exports come as standard-resolution PNG with a small "made with ultimaps.com" attribution. The Pro plan adds high-resolution PNG at roughly 7000×7000px, SVG that stays sharp at any size for print, and PDF. Paid exports carry no branding. Most map providers don't offer that without visible attribution.
Interactive Embeds
Any map can be published and embedded on a website with a single line of code. Visitors can hover over regions for tooltips and click for more detail. Embeds work on any CMS or site builder and stay responsive across devices.
Legends and Smart Color Scaling
Add categorical or value-based legends so readers know what each shade means. For choropleth maps built from data, smart color scaling picks the palette and breakpoints for your dataset. That saves the fiddly trial and error of choosing thresholds by hand.
Custom Map Service
For regions or divisions the library doesn't cover, such as a state split into custom zones or a world map with a specific projection, Ultimaps builds it for you. Custom maps start at €49 and usually take 1 to 3 business days.
Pros and cons
Pros
- Free plan is genuinely usable, with unlimited maps and no required sign-up just to color one.
- Data import is forgiving, matching messy spreadsheet columns to regions automatically.
- Paid exports are attribution-free, unlike many tile-based or OpenStreetMap tools.
- Interactive embeds are simple, one line of code on any CMS or site builder.
- Custom map service covers regions the standard library misses.
Cons
- It isn't a GIS. No street-level tiles, satellite imagery, or custom projections, so it won't fit detailed geographic work.
- High-resolution PNG, SVG, and PDF exports sit behind the €49/month Pro plan, which is steep for occasional users.
- The Pro plan includes one workspace user, so teams sharing a single seat need to look at the Custom tier.
- Free exports carry the "made with ultimaps.com" attribution, which rules them out for polished client or investor material.
Frequently asked questions
Ultimaps is a map maker for turning region-based data into color-coded maps. People use it to build sales territory maps, real estate portfolio maps, election maps, and demographic charts from a spreadsheet or a short AI prompt.
Related content
Explore related tools, skills, and articles for Ultimaps.
Ultimaps Alternatives

Google EmbeddingGemma 2
Google DeepMind · Writing · Image · CodingGoogle EmbeddingGemma 2 is a 740M-parameter open model that turns text, code, images, audio, and video frames into vectors in one 768-dimension space, running on phones and laptops.

Tractionwave
TractionWave · Image · MarketingTractionWave is an AI attention heatmap tool for static ads. Upload a PNG or JPG and it returns predicted attention, ranked hotspots, and fixes before you spend budget.

Imejis.io
Imejis.io · Image · MarketingImejis.io is an AI design studio for agents and marketing teams. Describe an image in plain words, and it writes the copy, builds the layout, reflows it to every size, then exports a finished file.