

AI Infographics
Masonry AI Inc · Image · Productivity
AI Infographics is an AI infographic generator that turns a stat, outline, or rough sketch into a polished, on-brand visual in seconds, covering data viz, comparisons, and timelines.
About AI Infographics
What Is AI Infographics
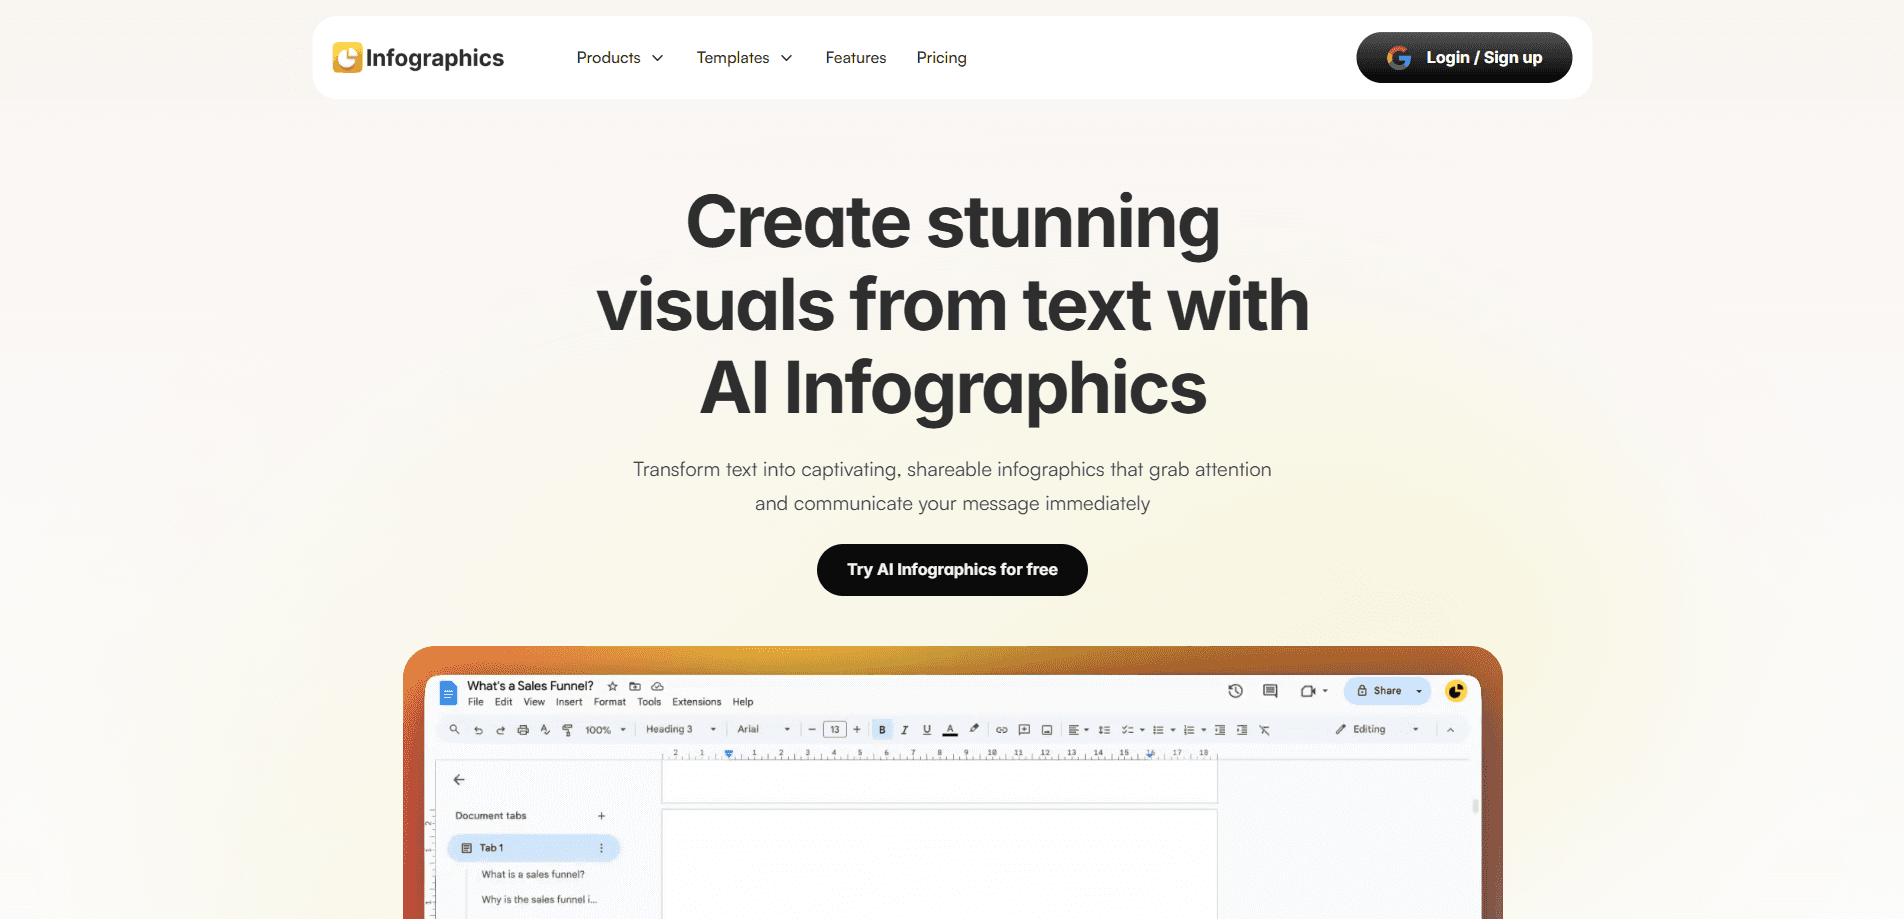
AI Infographics is a browser-based AI design tool for making infographics, aimed at marketing and content teams. You drop in a stat, an outline, a transcript, or a rough sketch, and it returns finished infographics you can place in decks, social posts, and reports. The pitch is speed: what used to take a designer days now lands in seconds.
The tool stands out by putting many top image models in one workspace. Instead of locking you into one engine, it lets you run the same brief through several models and compare the results side by side. For infographics that matters because legible in-image text and clean charts are the hardest parts to get right, and different models handle them better than others.
The tradeoff: the tool was built for marketing visuals, not precise statistical charts. If you need exact axis values from your own dataset, a spreadsheet still does that better. Treat the output as creative work you check before shipping.
Getting Started
- Open the site and start creating for free. No card is required for the welcome credits.
- Drop in your content: a stat, an outline, a transcript, or a rough sketch. Add a brand reference image if you have one.
- Pick a format and a style, such as a process flow, comparison, timeline, list, data viz, or stat strip, and describe the look you want.
- Generate several concepts at once and compare them across models.
- Refine the prompt, swap the palette, regenerate a section, and export in high resolution.
Product Information
A quick look at AI Infographics's pricing, supported platforms, and performance.
Best for
The users, tasks, and scenarios where this tool fits best.
Users
- Marketing and content teams
- Solo creators and small businesses
- Social media managers
Tasks
- Turning a blog post into a shareable visual
- Building sales and pitch visuals
- Explaining a process or roadmap
Scenarios
- Launch announcements
- Report and whitepaper figures
- Campaign series
Key features
One workspace, many AI models
AI Infographics runs your brief through several leading image models, including Ideogram V3, Recraft V3, Nano Banana Pro, Seedream 4.5, FLUX.2 Pro, and GPT Image 2. Each one is stronger at a different job, so you compare results and keep the best rather than settling for one engine's output.
Legible text inside the image
The biggest failure mode for any infographic maker is garbled text. Models tuned for typography, especially Ideogram V3 and Recraft V3, render labels, axis text, and short callouts cleanly, so the result reads as a designed piece instead of an obvious mockup.
A library of infographic formats
Name the format you need and the tool generates it: process flows, comparisons, timelines, big-number stat strips, lists and checklists, data visualization charts, org charts, anatomy breakdowns, and geographic visuals. You can also anchor a generation on a reference image to match a house style.
Any style on demand
Flat, isometric, hand-drawn, neon, editorial, minimal, and dark mode are all available. You can restyle the same content across looks with a single prompt, which helps when one team needs a clean report figure and another wants a bold social graphic.
Brand-anchored output
Upload a brand reference, call out the palette and typography you want, and the tool keeps the look consistent across a series. For longer campaigns, more controllable models like FLUX and Recraft help lock a single house style.
High-resolution, commercial-ready export
Exports run up to 4K, and every generated infographic is licensed for commercial use. That covers client decks, paid campaigns, landing pages, and printed handouts without watermarks or per-image fees.
Pros and cons
Pros
- Generates a finished infographic in seconds, which is far faster than the days a designer typically needs.
- Comparing several AI models in one place means you're not stuck with a single engine's weak spots.
- Plans start at $20 a month, well below the $200 or more a freelancer often charges per visual.
- Output is licensed for commercial use and exports up to 4K.
Cons
- Precise, data-accurate charts are not the strength here; you'll get the gist of your numbers, not a guaranteed exact plot.
- One engine rarely nails a complex layout on the first pass, so expect to regenerate and compare a few options.
- The model lineup and pricing shift quickly, so confirm current details on the site before you commit.
Frequently asked questions
It generates polished infographics from a text brief. Drop in a stat, an outline, a transcript, or a sketch, and the text to infographic flow returns visuals like process flows, comparisons, timelines, and data charts in seconds.
Related content
Explore related tools, skills, and articles for AI Infographics.
AI Infographics Alternatives

Tractionwave
TractionWave · Image · MarketingTractionWave is an AI attention heatmap tool for static ads. Upload a PNG or JPG and it returns predicted attention, ranked hotspots, and fixes before you spend budget.

Imejis.io
Imejis.io · Image · MarketingImejis.io is an AI design studio for agents and marketing teams. Describe an image in plain words, and it writes the copy, builds the layout, reflows it to every size, then exports a finished file.

Layoutr
Van Dijk Ontwikkeling · Image · China AILayoutr is a browser floor plan tool that scales your own plan, places furniture at true size, shows the room in 3D and renders it with AI.