

ChartGen AI
ChartGen.ai · Image · Coding
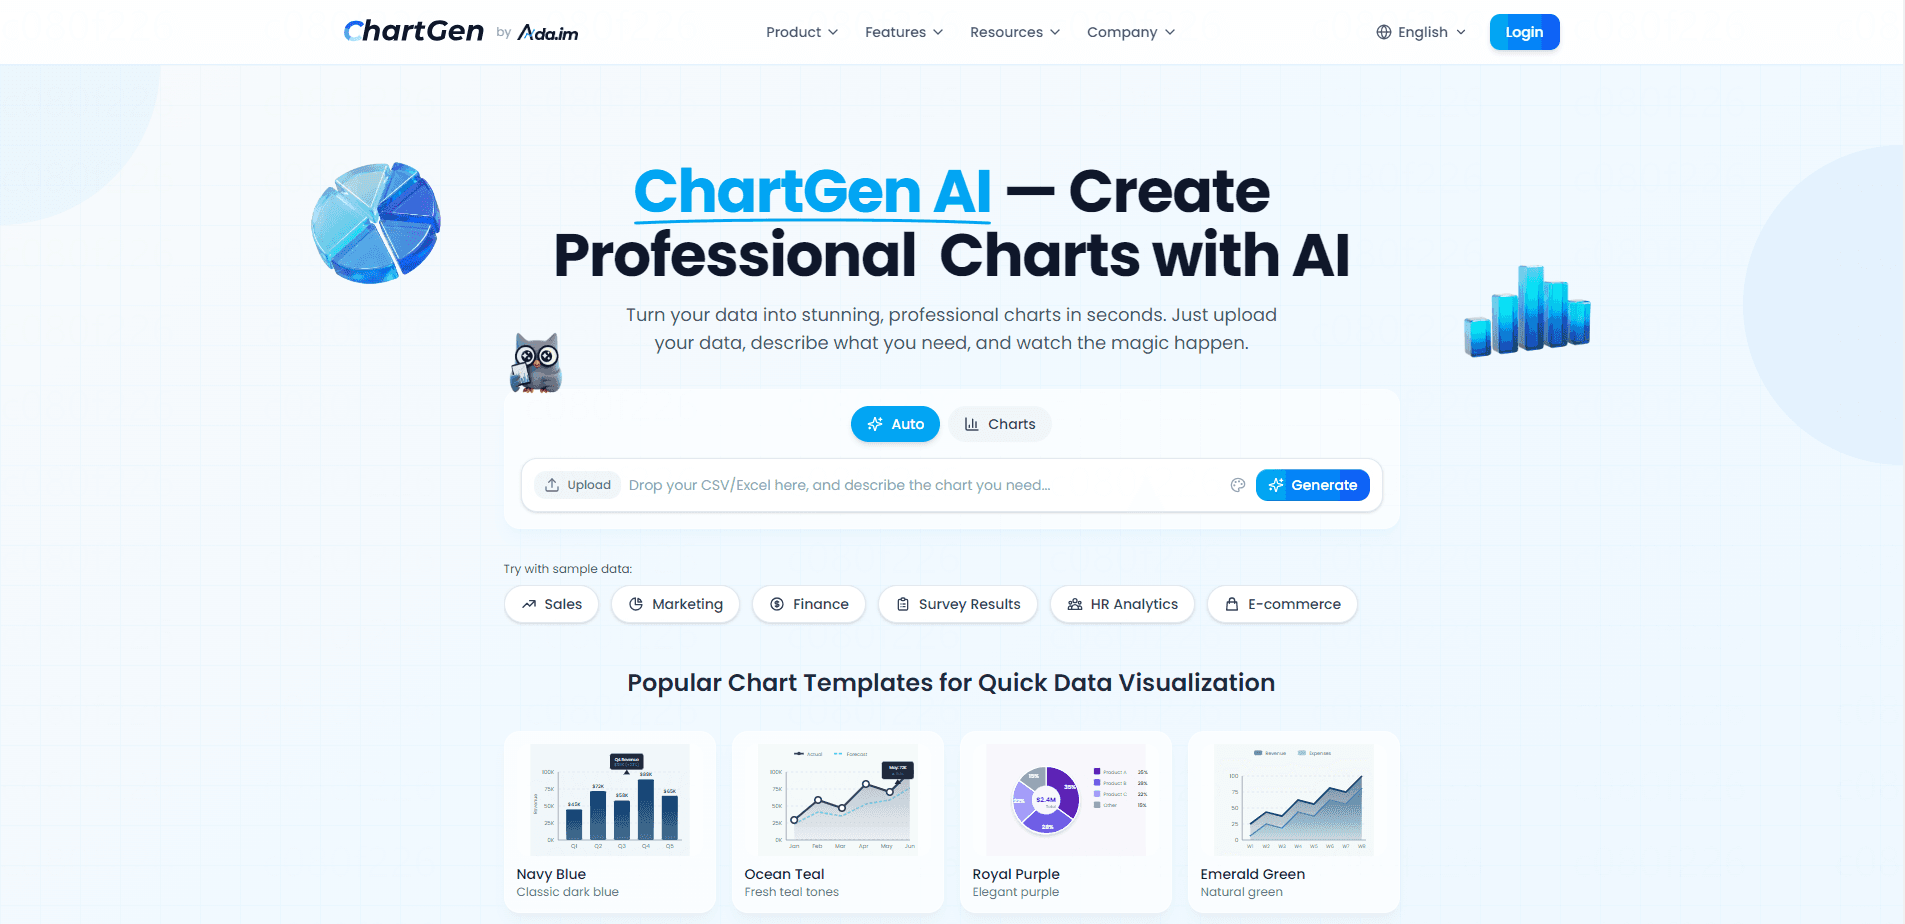
ChartGen AI is an AI chart generator that turns raw data into finished visualizations from a short text prompt. You upload a CSV, Excel, JSON, or Google Sheets file, describe the chart you want in plain language, and it picks a chart type, maps your columns, and renders the result. CSV to chart takes seconds. So does Excel to chart. It suits analysts, marketers, and founders who need report-ready charts without touching spreadsheets or a design tool.
About ChartGen AI
What Is ChartGen AI
ChartGen AI is a browser-based data visualization tool built around natural language. Instead of dragging fields onto axes, you tell it what you want ("show monthly revenue as a line chart") and it works out the structure of your data on its own. Who is that for? Mostly people who need an answer, not a workflow.
The pitch is speed for people who don't live in BI software. Most teams have the data already. What they lack is the time to clean it, pick a chart, and style it before a meeting. ChartGen aims to collapse that whole loop into one prompt, so you can go from text to chart without opening a second app.
The main limit is control. Prompt-driven generation is fast, but anyone who needs fine-grained formatting, computed columns, or a custom data model will still reach for a spreadsheet. ChartGen is a shortcut, not a replacement for a full analytics stack. Different job.
Getting Started
- Sign up at chartgen.ai and open the workbench.
- Upload your data as a CSV, Excel, or JSON file, paste rows directly, or connect a Google Sheets source.
- Describe the chart in plain English, like "compare Q1 sales by region as a bar chart."
- Let the tool detect the dimensions and measures, then switch the chart type or tweak labels if the first pass isn't right. No guessing.
- Export the finished chart as PNG, or use SVG and PDF on a paid plan.
Product Information
A quick look at ChartGen AI's pricing, supported platforms, and performance.
Best for
The users, tasks, and scenarios where this tool fits best.
Users
- Data analysts who need a first draft of a chart fast, then refine it by hand
- Marketing and growth teams juggling numbers from several ad platforms
- Founders and operators who report on metrics but don't want to open a BI tool
Tasks
- Turning a CSV or Excel export into a chart for a report or slide deck
- Building a one-off visualization from pasted rows
- Generating multiple chart types from the same dataset to see which reads best
Scenarios
- Prepping a weekly numbers review minutes before the meeting
- Exploring a new dataset you just downloaded
- Adding charts to a client deliverable under a tight deadline
Key features
Prompt-Driven Chart Generation
You describe the chart in everyday language and ChartGen AI figures out the dimensions, measures, and aggregation behind it. There's no need to learn a formula language or drag fields into place. For anyone who can explain what they want, that's the whole interaction. That's it.
Broad Chart Type Coverage
It covers the common set: bar, line, pie, area, scatter, heatmap, combo, waterfall, and funnel charts. When you aren't sure which one fits, the tool suggests a type based on your data's shape, and you can override it. That range covers most chart generator for reports needs in one place.
Multiple Data Input Formats
ChartGen AI accepts CSV, Excel, and JSON uploads, pasted rows, and Google Sheets as a syncing source. If your data already lives somewhere tabular, you can usually get it in without reshaping it first. Live sync from Sheets matters for numbers that change from week to week.
Themes and Styling Controls
It ships with a set of business-ready color themes and lets you adjust sorting, label display, and aggregation. You can also set custom colors to match a brand. The styling is built for charts that go in front of an audience, not just on your own screen. Good enough for most decks.
Export Options
Free use covers high-resolution PNG downloads, while paid plans add SVG, PDF, and embed code. SVG and PDF hold up in decks, printed reports, and dashboards, where a compressed PNG would look soft. The format choice follows where the chart is headed. Pick the wrong one and it shows.
Security and Compliance
ChartGen AI states it meets SOC 2 standards and uses end-to-end encryption for your data. For teams handling internal or client numbers, that's the kind of claim worth checking against your own review process before you upload anything sensitive. Fair point.
Pros and cons
Pros
- Turns a prompt into a finished chart in seconds, which cuts the styling step most people dread.
- Handles CSV, Excel, JSON, pasted text, and Google Sheets, so you rarely need to reshape data first.
- Nine chart types with automatic recommendations cover most everyday reporting needs.
- Free PNG exports mean you can evaluate it fully before paying for SVG or PDF.
- SOC 2 compliance and encryption address a common worry about uploading business data.
Cons
- Prompt-based control gets in the way when you need precise formatting or calculated fields, and you'll end up fixing things elsewhere.
- Fewer fine-grained layout options than a spreadsheet or dedicated BI tool, so a pixel-perfect chart may still take manual work.
- Export formats beyond PNG sit behind a paid plan, which limits free use for print or dashboard work.
Frequently asked questions
It creates charts and data visualizations from your data using text prompts. You bring a CSV, Excel, or Google Sheets file, describe the chart you want, and it generates it. It's aimed at reporting, presentations, and quick data exploration, and it works best when the numbers are already clean and sitting in a table you can hand over.
Related content
Explore related tools, skills, and articles for ChartGen AI.
ChartGen AI Alternatives

X Ray Interpreter
X-ray Interpreter · ImageX Ray Interpreter is a web-based AI radiology tool that turns X-rays, CT scans, MRI, ultrasound, and PET images into plain-language reports. You upload a scan, get a preliminary X-ray interpretation in moments, then ask follow-up questions if something needs explaining. It works as a second opinion and a learning aid, not as a medical diagnosis.

Aieasypic
AIEasyPic · ImageAIEasyPic is an AI image generator that turns plain text prompts into finished artwork in seconds. You can also train custom models on your own photos, swap faces in existing images, and create short video clips from text, all from a browser. It suits casual creators who want quick visuals and hobbyists who want to build a personal model without touching any code.

Chargen
Chargen · ImageChargen is an AI character generator and worldbuilding toolkit built for Dungeons & Dragons and other tabletop RPGs. It turns a one-line idea into a painted character portrait, spins up NPCs, monsters, maps and encounters from the same session, and keeps every creature's details close at hand. The tabletop RPG art side runs on a credit system called Gold, while the text generators stay free for everyone.