

Databox
Databox, Inc. · Coding
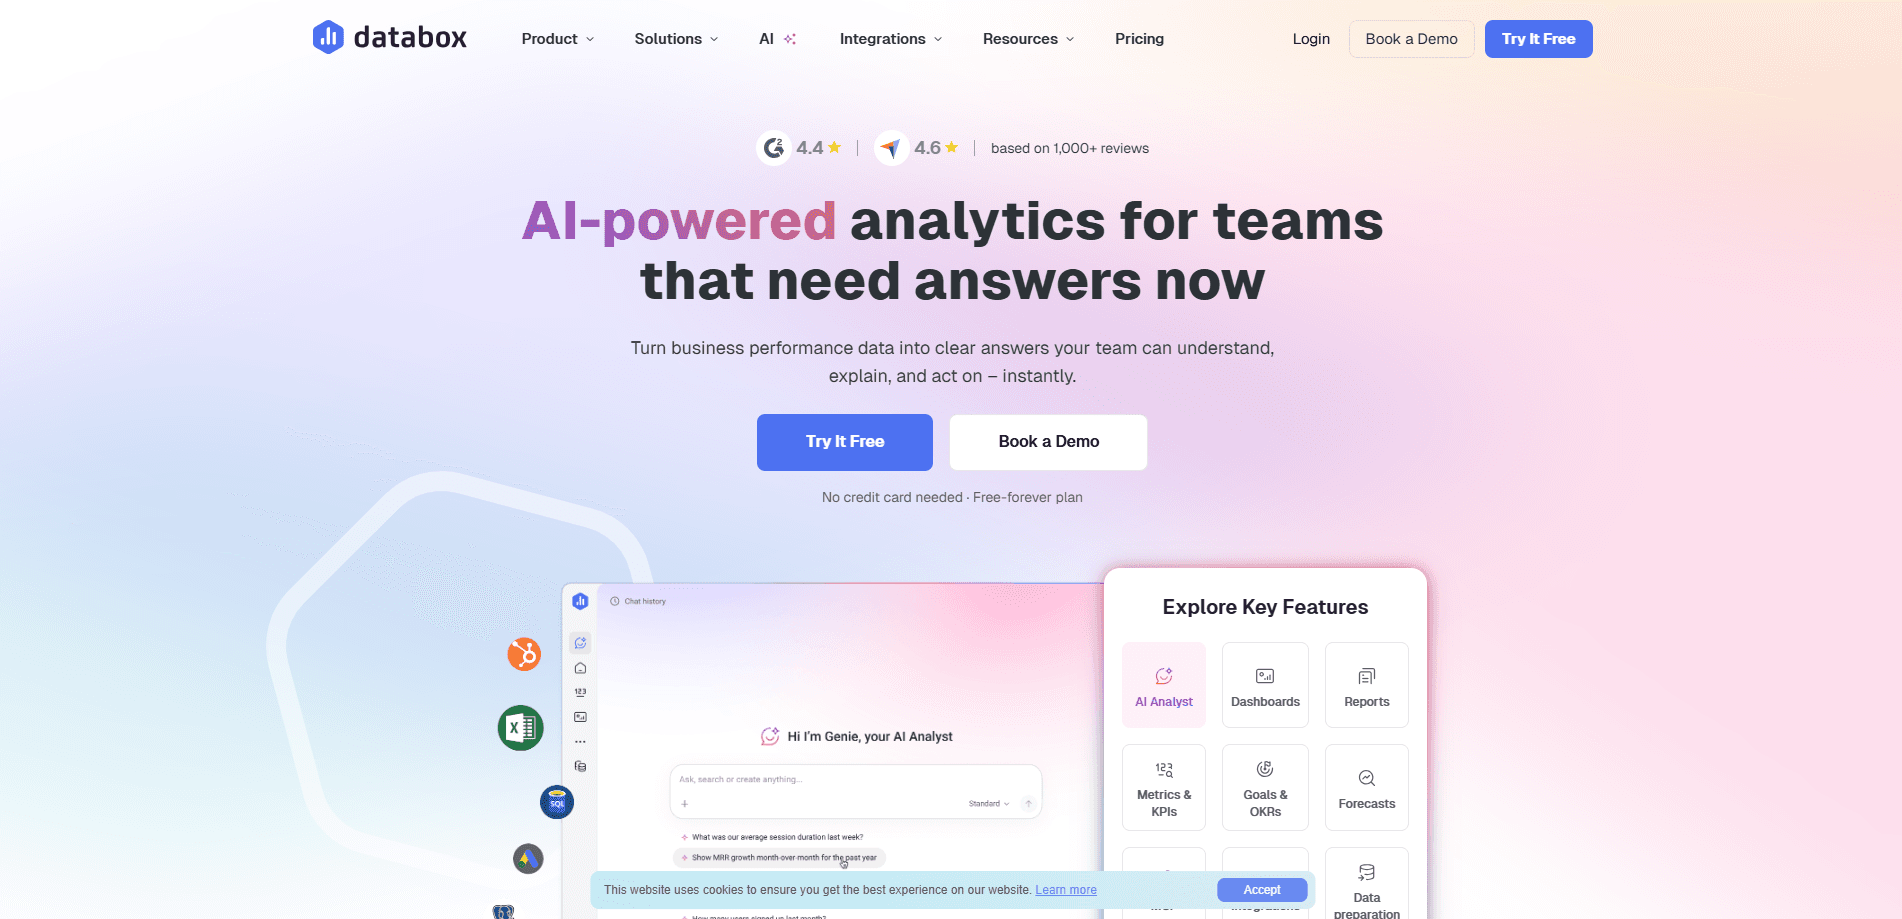
Databox is a business intelligence platform that brings performance data from 130+ tools into one place. Instead of logging into a dozen tabs to check numbers, you connect your sources once, define each metric, and let Databox's AI analyst answer questions about what changed and why. It suits marketing teams, agencies, and solo operators who want reporting without hiring a data engineer. The free plan covers the basics; paid plans scale up on users, data sources, and AI credits.
About Databox
What Is Databox
Databox is a cloud-based business intelligence and analytics dashboard built by Databox, Inc., a Boston company. It targets the everyday reporting problem: your numbers live in Google Analytics, your CRM, your ad platforms, and a spreadsheet someone maintains by hand. Databox connects those sources, syncs them on a schedule, and puts them on shared dashboards your whole team reads. One place. One number.
The newer pitch is AI on top of that foundation. Databox markets itself as an agentic analytics platform, meaning its AI analyst (Genie) can query your metrics, summarize performance, and flag anomalies. The catch is that it only reads data you've already connected and defined, so setup quality decides how useful the answers are. Garbage in, garbage out.
A second limit worth knowing: Databox isn't a raw data warehouse. If you need to run custom SQL joins across huge datasets, you'll outgrow it. It's built for tracking and sharing KPIs, not for heavy data engineering.
Getting Started
- Create a free account with your email. No credit card is needed for the free-forever plan.
- Connect a data source from the library, such as Google Analytics, HubSpot, or a database, and let the one-click auth handle the setup.
- Pick the metrics you want to track and name them so each dashboard, report, and AI answer uses the same definition.
- Build a dashboard from a template or a blank canvas, then drag in the metrics your team checks most.
- Invite teammates or clients, set a sync schedule, and share the dashboard or a scheduled report. That's it.
Product Information
A quick look at Databox's pricing, supported platforms, and performance.
Best for
The users, tasks, and scenarios where this tool fits best.
Users
- Marketing teams at growing businesses
- Agencies managing multiple clients
- Solo operators and consultants
Tasks
- Building a KPI dashboard
- Running a weekly client or team report
- Tracking a campaign's performance
- Monitoring for anomalies
Scenarios
- Agency reporting day, when you need to ship the same report to twenty clients before lunch.
- A startup founder checking Monday-morning numbers before a team standup.
- A finance or support lead who needs one dashboard for metrics that now live in five different tools.
- An AI consultant who wants their own agents to query verified business data through the MCP connector.
Key features
AI Analyst (Genie)
Genie is Databox's conversational AI layer. You ask a question in plain language, like which campaign drove last month's revenue, and it answers using the metrics you've connected. It also writes performance summaries and points out anomalies. It's grounded in your defined data, so the answers are only as good as what you've linked. Ask it something you never connected, and it has nothing to say.
130+ Data Integrations
The integration library covers marketing, sales, finance, and support tools, plus databases, warehouses, Google Sheets, Excel, and workflow apps like Zapier. Each integration ships with curated metrics, so you don't map fields by hand. Missing your favorite tool? A no-code builder connects to most REST APIs, which covers nearly everything with a live endpoint.
Custom Dashboards and Reports
You build dashboards from templates or a blank canvas, then arrange widgets for the metrics that matter. Reports can be scheduled to send on a cadence or shared as live links. This is the core of the product, and it stays available on every plan, including free.
MCP Server and API Access
Databox runs an MCP server that links Claude, ChatGPT, and n8n to your metrics, so external AI tools answer from data you already trust instead of guessing at numbers they can't see. Paid plans also add API access for teams that want to build their own connections. This matters if you're wiring Databox into a wider AI workflow.
Governed Semantic Layer
Every metric gets defined once and reused everywhere, which Databox calls a single set of trusted numbers. Data lineage shows where a number came from. Time zones, date formats, and changing values get normalized on each sync. It's a quiet feature that prevents the classic two-teams-two-numbers argument.
Anomaly Detection and Routines
Databox watches your metrics for changes that fall outside normal ranges and surfaces them with context. On higher plans, routines let you automate responses, like alerting a Slack channel when a metric breaks a threshold. Genie also works inside Slack on the Team plans.
Pros and cons
Pros
- Free-forever plan with real reporting features, not just a short trial.
- 130+ integrations with pre-built metrics cut hours of manual setup.
- AI analyst and MCP server connect your metrics to tools like ChatGPT and Claude.
- Scheduled reports and client sharing make agency reporting largely automatic.
- Encrypted, access-controlled data that Databox says is never used to train AI models.
Cons
- The $249/mo Team Core plan jumps sharply from the free tier, which stings for small teams.
- AI credits are capped per plan, so heavy AI use costs extra or forces an upgrade.
- Not a data warehouse, so complex custom queries and very large joins aren't its job.
- Some of the most useful features, like custom skills and Genie in Slack, sit behind the higher Team tiers.
Frequently asked questions
Databox is a reporting tool that pulls performance data from your other tools into one place, then shows it on dashboards. Its KPI tracking software keeps every number in one view. Its AI analyst answers questions about your metrics and flags anything unusual. Think of it as a reporting hub, not a place where your raw data lives.
Related content
Explore related tools, skills, and articles for Databox.
Databox Alternatives
Forefront
Forefront · CodingForefront is a web platform for building with open-source AI. It lets you fine-tune leading open-source language models on your own data, evaluate how they perform, and run them through an API or export them to host yourself. Developers who want the convenience of a closed-source platform but insist on owning their models and data are the target audience here.

Startkit
StartKit.AI · CodingStartkit is a boilerplate for building AI SaaS and AI wrapper products. Think of it as an AI startup boilerplate with the boring parts already wired up: authentication, Stripe and Lemon Squeezy payments, usage limits, transactional email, and an AI API starter that talks to OpenAI, Anthropic, Groq, or Llama. You clone the repo, set your price, and start on the part of your product that people actually pay for. It's Next.js under React and Tailwind, so most of the boilerplate code already feels familiar.
Testim
Tricentis · CodingTestim is an AI-powered test automation platform for building and running end-to-end tests across web, mobile, and Salesforce applications. It leans on machine learning to keep tests stable when an interface changes, so teams spend less time fixing broken selectors. Not bad for an automated testing tool you can start using today. You create tests by recording actions in a browser, then optionally add JavaScript when you need more control. It's a solid pick for busy QA teams.