

Datastripes
Datastripes · Coding
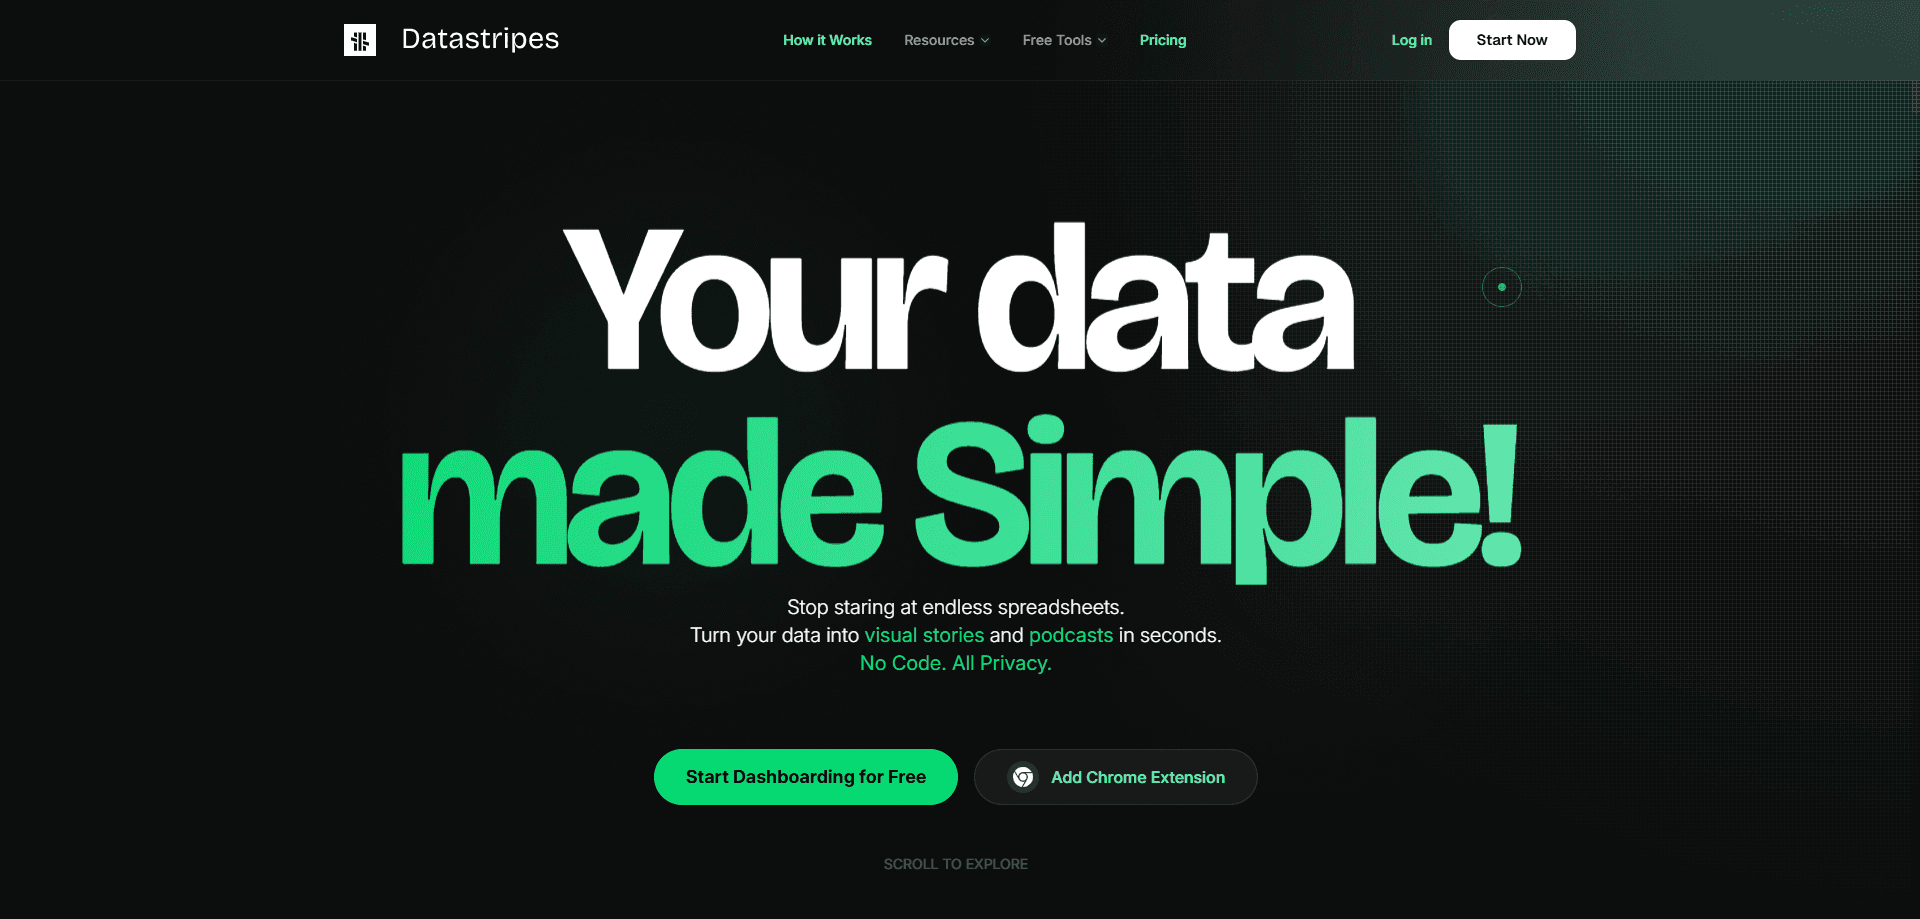
Datastripes is a no-code data analysis platform that runs entirely in your browser, letting you turn a plain spreadsheet into a live dashboard with charts, forecasts, and narrated insights. It bundles spreadsheet formulas, drag-and-drop nodes, and AI assistance into one workspace, so you can group, model, and explore data without writing code or moving it to someone else's servers. The tool targets analysts, founders, and small teams who want business intelligence power without the setup cost of a traditional BI stack.
About Datastripes
What Is Datastripes
Datastripes is a browser-based spreadsheet on steroids, built for people who think in cells but want dashboard-grade output. You paste or upload a table, apply functions like grouping and aggregation, then watch KPIs and charts refresh as the underlying numbers change. The pitch is simple: business intelligence power paired with spreadsheet simplicity, with AI forecasting and what-if scenarios layered on top. Think of it as an online data visualizer that speaks spreadsheet.
The platform keeps its computations local. According to the company, your database stays behind your firewall and no data is centralized, which matters if you work with numbers you can't ship to a hosted BI vendor. It also pulls live data straight into cells, so crypto prices, exchange rates, or any JSON API feed can sit next to your own figures.
The main trade-off is depth versus polish. Datastripes leans on formulas and cells rather than a point-and-click report builder, so a total beginner may need an afternoon to get comfortable. It's also a younger product. That means fewer integrations and templates than the household-name BI suites. Plan accordingly.
Getting Started
- Open app.datastripes.com in your browser. No install and no credit card are needed for the free tier.
- Create a project, then paste a table or connect a source such as an API, a stock feed, or a crypto price.
- Write or reuse formulas such as GROUP_BY, FORECAST, or IRR directly in cells to transform and model the data.
- Drag widgets onto the dashboard canvas and let the raw table explode into KPIs and charts.
- Ask the live AI analyst to narrate the dashboard, then share the result or upgrade when you need more projects.
Product Information
A quick look at Datastripes's pricing, supported platforms, and performance.
Best for
The users, tasks, and scenarios where this tool fits best.
Users
- Solo analysts who want BI-grade dashboards
- Startup founders tracking their own metrics
- Small teams that can't centralize data
Tasks
- Turning a raw CSV or Excel export into a dashboard
- Forecasting a metric
- Financial modeling
Scenarios
- Weekly KPI reviews
- Early-stage project research
- Scenario planning for a budget
Key features
Spreadsheet Formulas for Data Science
Datastripes puts advanced operations inside ordinary cells. Functions like GROUP_BY handle categorical grouping and aggregation without pivot tables, while NPV, IRR, and CAGR cover financial math. The result is that complex transformations happen where your data already lives, not in a separate scripting step. That's the core idea.
AI Forecasting and AutoML
You can apply linear regression, K-Means clustering, and Holt-Winters forecasting to a range of cells. A formula such as FORECAST(12, B2:B10, A2:A10) projects future values straight into the sheet. It shortens the gap between a raw column and a usable prediction. You still need clean, regular data for sound results. Garbage in, garbage out.
Live Data Connectors
Datastripes fetches JSON APIs, crypto prices, and exchange rates directly into cells using functions like HTTP_GET, and it caches results for the session. You don't manage API keys or write scripts for common feeds. That makes it easy to combine your own numbers with live external signals in one place. Set it once and forget it.
One-Click Dashboards
A single click turns a raw data table into an operational dashboard with KPIs and charts. Because the widgets stay linked to the source, updates flow through automatically. It's the feature that lets a spreadsheet user skip the usual report-building ceremony. No drag-and-drop marathon required.
Narrated Dashboards and AI Commentary
A live AI analyst can read the dashboard patterns and produce commentary on what the numbers show. This is useful for people preparing a quick summary for a meeting. Treat the narration as a starting point, not a finished analysis. It's a draft, not a verdict.
What-If Scenario Modeling
The platform lets you adjust assumptions and watch the projection move, using optimistic and pessimistic multipliers on a forecast. For budgeting or fundraising decks, it answers the "what happens if" question without a rebuild. Fast enough for a live meeting.
Local Computations and Data Privacy
The spreadsheet runs in your browser and performs calculations locally using caching. According to Datastripes, your database stays behind your firewall and nothing is centralized on their side. For teams with strict data rules, this changes whether the tool is even an option. That's a big deal for finance and health teams.
Pros and cons
Pros
- Runs fully in the browser with local computation, so you can analyze sensitive data without centralizing it.
- Combines spreadsheet formulas, AI forecasting, and dashboards in one workspace, cutting tool-switching.
- Live connectors pull crypto, stock, and JSON API data into cells without scripts or API key management.
- Free tier is genuinely usable with 3 projects, so you can test it before paying.
Cons
- The formula-and-cells approach has a learning curve, so non-spreadsheet users may stall early on.
- Newer platform means fewer integrations and ready-made templates than established BI tools.
- Previewed pricing is in euros, a small friction point for US-based buyers used to dollar billing.
Frequently asked questions
It's an online spreadsheet that doubles as a data analysis and dashboard tool. You load a table, apply formulas and AI functions, then present the result as live charts and KPIs without writing code.
Related content
Explore related tools, skills, and articles for Datastripes.
Datastripes Alternatives
Forefront
Forefront · CodingForefront is a web platform for building with open-source AI. It lets you fine-tune leading open-source language models on your own data, evaluate how they perform, and run them through an API or export them to host yourself. Developers who want the convenience of a closed-source platform but insist on owning their models and data are the target audience here.

Startkit
StartKit.AI · CodingStartkit is a boilerplate for building AI SaaS and AI wrapper products. Think of it as an AI startup boilerplate with the boring parts already wired up: authentication, Stripe and Lemon Squeezy payments, usage limits, transactional email, and an AI API starter that talks to OpenAI, Anthropic, Groq, or Llama. You clone the repo, set your price, and start on the part of your product that people actually pay for. It's Next.js under React and Tailwind, so most of the boilerplate code already feels familiar.
Testim
Tricentis · CodingTestim is an AI-powered test automation platform for building and running end-to-end tests across web, mobile, and Salesforce applications. It leans on machine learning to keep tests stable when an interface changes, so teams spend less time fixing broken selectors. Not bad for an automated testing tool you can start using today. You create tests by recording actions in a browser, then optionally add JavaScript when you need more control. It's a solid pick for busy QA teams.