

Easy App Reports
Easy App Reports · Coding · Marketing
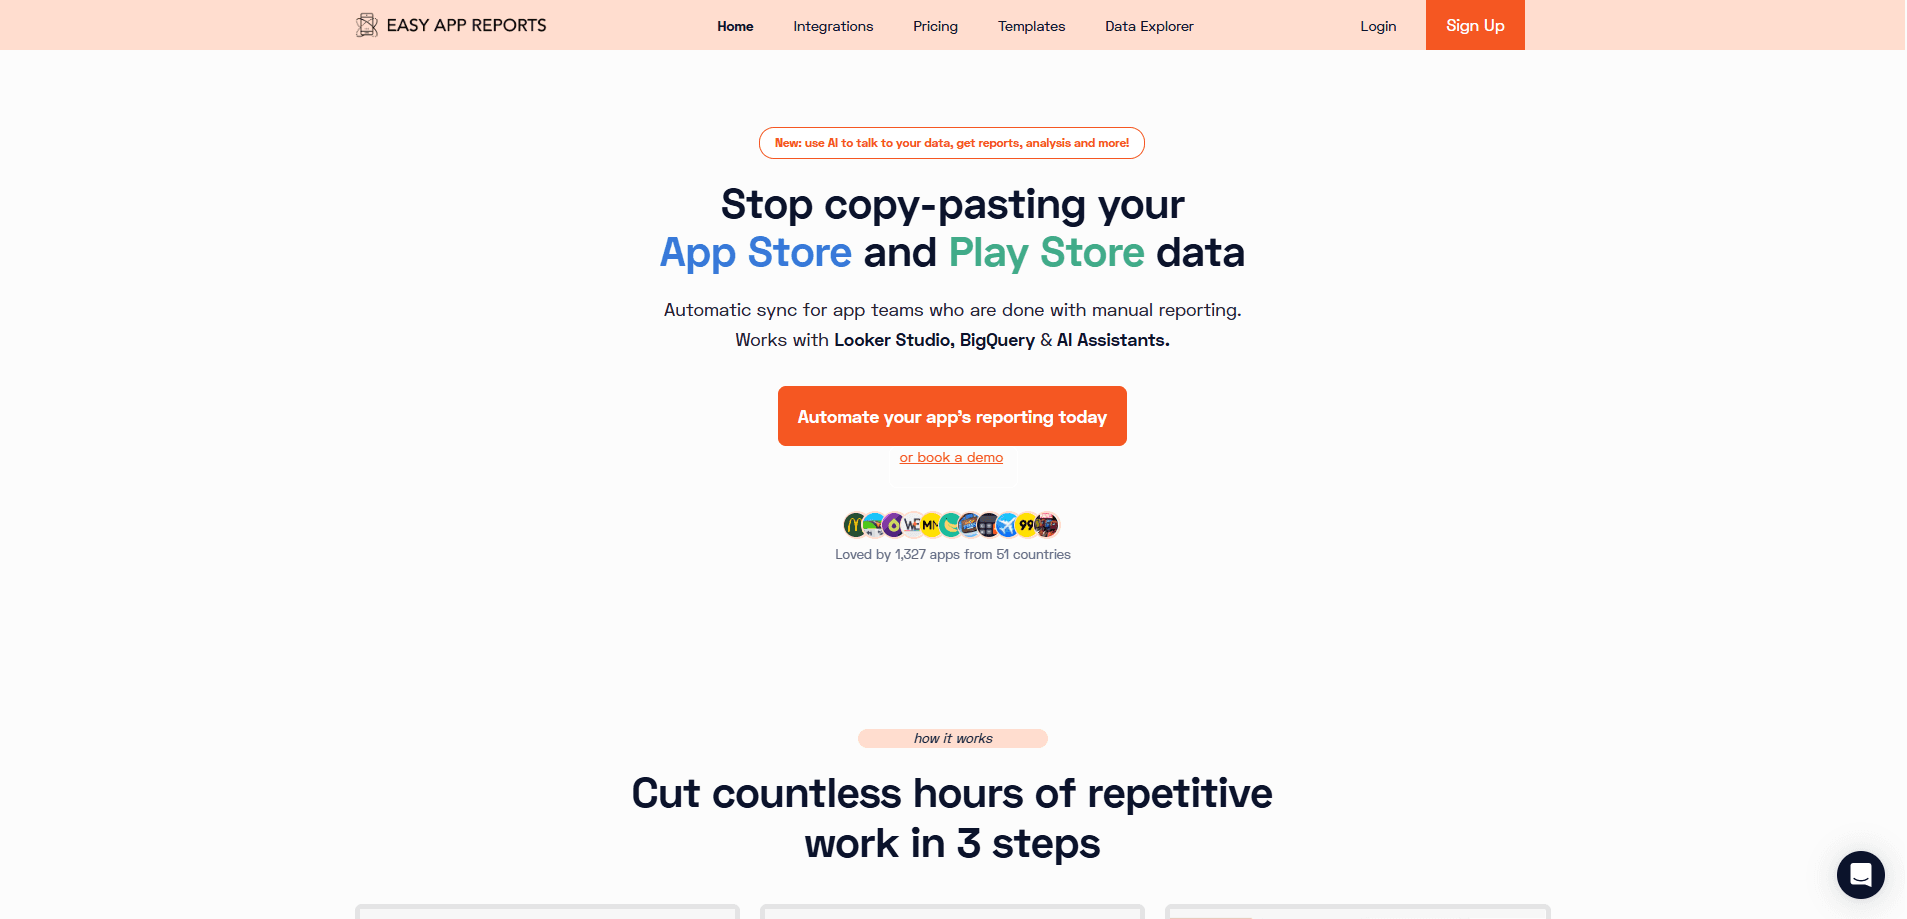
Easy App Reports is a SaaS platform that connects your App Store and Google Play accounts and turns the numbers inside them into automated reports, dashboards, and AI-ready data. Think of it as an app analytics reporting tool that does the copying for you. Instead of exporting CSVs by hand every week, you link a developer account and let the platform sync impressions, downloads, revenue, reviews, and UA spend on its own. The output lives in Google Looker Studio or BigQuery, and an MCP integration lets ChatGPT, Claude, or Gemini query the same data directly. It's built for app companies, studios, and agencies that report on many apps and accounts at once.
About Easy App Reports
What Is Easy App Reports
Easy App Reports sits between the app stores and your reporting tools. It reads data through the official Google Play and App Store Connect APIs, stores it in BigQuery, and pushes it to Looker Studio dashboards or an AI assistant over MCP. No scraping and no CSV juggling. The company counts more than 1,300 apps from 51 countries on the platform.
The problem it solves is repetitive reporting. Someone on the team usually spends hours each week copying numbers out of the App Store and Google Play consoles into a spreadsheet. It's tedious. Easy App Reports syncs that data on a schedule and keeps history, so the numbers are ready before anyone asks. For agencies and portfolio owners, it also merges multiple developer accounts into one place, with the option to keep each app's dashboard separate.
It isn't a polished consumer product. It's aimed squarely at teams. The main limits are structural. It's a reporting and visualization layer, not a product-analytics suite, so it only sees what the store APIs expose. It doesn't track in-app events or funnels the way tools like Amplitude do. There's also no self-serve free tier, and onboarding is sold as a paid add-on. That raises the entry cost for a solo developer.
Getting Started
- Create an account on the Easy App Reports site and open the pricing page to pick a base plan.
- Connect your developer accounts by linking the Google Play API and App Store Connect API credentials for each one.
- Choose a destination: a Looker Studio connector for ready-made dashboards, or Google BigQuery if you want the raw dataset.
- Copy one of the Magic Templates in Looker Studio, or point an MCP-compatible AI assistant at your data.
- Pick the KPIs and dimensions you care about, then let the sync run on autopilot and refresh your reports.
Product Information
A quick look at Easy App Reports's pricing, supported platforms, and performance.
Best for
The users, tasks, and scenarios where this tool fits best.
Users
- App companies and studios
- Agencies and app portfolios
- VCs and portfolio managers
Tasks
- Automating weekly KPI reports
- Tracking subscription revenue
- Asking questions of your data
- Monitoring paid acquisition
Scenarios
- A studio shipping several games needs one dashboard per title but pulls each one from the same frozen dataset.
- An agency onboards a new client and wants the first report ready the same week, not after a month of setup.
- A portfolio manager checks how each app's conversion rate moved after a store listing change.
Key features
Automatic Data Sync From Official APIs
The core job is keeping your store numbers current without anyone touching a spreadsheet. Easy App Reports connects through the Google Play and App Store Connect APIs, and the company states it uses only official, trustworthy APIs with no scraping or expiring auth tokens. Once an account is linked, data flows into your reports on autopilot. Nobody exports anything. The dashboard someone opens on a Monday morning already reflects the weekend's downloads and revenue.
Looker Studio Magic Templates
Instead of building a dashboard from a blank canvas, you copy a ready-made app KPI dashboard and make it yours. The company calls these Magic Templates, and they cover common report layouts for downloads, revenue, ratings, and UA metrics. It's the fastest path from connected data to a shareable report. That matters when you're delivering to clients or executives who just want the chart.
AI Integration Over MCP
The MCP integration is what separates this from a plain connector. You can wire your app data into ChatGPT, Claude, Gemini, or any MCP-compatible assistant and ask questions, generate reports, or run analysis in natural language. No dashboard building. No SQL. The company says MCP is available on all base plans, so it isn't locked behind a higher tier. So what does that look like in practice? You ask why uninstalls spiked last week instead of clicking through filters, and the assistant reads your BigQuery numbers to answer.
Multi-Account and App Consolidation
Agencies and portfolio owners can bring several developer accounts into one workspace and decide whether apps sit together or in separate dashboards. The All Sources option unifies data from multiple accounts into a single dataset, which is the practical way to compare performance across a portfolio. Each base plan includes two developer accounts. More are sold in blocks of six.
Hundreds of Metrics and Dimensions
The platform exposes a large catalog of data points, from units, first-time downloads, and redownloads to reviews, in-app purchases, subscription cancellations, crashes, and search terms. If a metric exists in the store API, the company says it can surface it, and it takes requests for anything missing. That breadth matters. The store consoles each show a narrow slice; here they land in one table.
Paid Media and BigQuery Destinations
Beyond store data, Easy App Reports pulls Meta Ads and Google Ads, and on higher tiers Apple Search Ads, so you can line up acquisition spend against installs. For teams that want full control, data can land in Google BigQuery and then feed Tableau, Power BI, or any tool that reads a warehouse. Pick this option when the prebuilt templates aren't flexible enough. It's the escape hatch.
Pros and cons
Pros
- Syncs store and paid-media data automatically, which removes the weekly export-and-paste routine.
- Uses official App Store and Google Play APIs rather than scraping, so the connection is stable.
- MCP integration lets AI assistants query your data without custom dashboards or SQL.
- Handles multiple developer accounts in one workspace, which fits agencies and portfolios.
- Data is hosted in the EU on ISO 27001 certified infrastructure and encrypted in transit.
- Publishes the full reports schema and subprocessor list, so you can verify what's collected.
Cons
- No free plan, and onboarding is sold as a paid add-on, so testing it means paying upfront.
- Base plans include only two developer accounts; every six more costs $99, which adds up for larger portfolios.
- It reports on what the store APIs expose, so in-app events and funnels aren't covered, which means you still need a separate product-analytics tool for those questions.
- Apple Search Ads data and BigQuery export sit on higher tiers, so budget plans lose some of the more advanced sources.
Frequently asked questions
It connects your App Store and Google Play accounts, syncs the performance data automatically, and pushes it into Looker Studio dashboards or BigQuery. From there you can read reports, share them, or query the data through an AI assistant. Think of it as a bridge between the app stores and the tools where you actually look at numbers.
Related content
Explore related tools, skills, and articles for Easy App Reports.
Easy App Reports Alternatives
Forefront
Forefront · CodingForefront is a web platform for building with open-source AI. It lets you fine-tune leading open-source language models on your own data, evaluate how they perform, and run them through an API or export them to host yourself. Developers who want the convenience of a closed-source platform but insist on owning their models and data are the target audience here.

Startkit
StartKit.AI · CodingStartkit is a boilerplate for building AI SaaS and AI wrapper products. Think of it as an AI startup boilerplate with the boring parts already wired up: authentication, Stripe and Lemon Squeezy payments, usage limits, transactional email, and an AI API starter that talks to OpenAI, Anthropic, Groq, or Llama. You clone the repo, set your price, and start on the part of your product that people actually pay for. It's Next.js under React and Tailwind, so most of the boilerplate code already feels familiar.
Testim
Tricentis · CodingTestim is an AI-powered test automation platform for building and running end-to-end tests across web, mobile, and Salesforce applications. It leans on machine learning to keep tests stable when an interface changes, so teams spend less time fixing broken selectors. Not bad for an automated testing tool you can start using today. You create tests by recording actions in a browser, then optionally add JavaScript when you need more control. It's a solid pick for busy QA teams.