

Glassbrain
Glassbrain · Coding
Glassbrain is an AI debugging platform built for developers who ship AI features and need to know why a model failed. Think of it as an AI bug fixer that works on behavior, not crashes. It captures each run as a visual trace tree, lets you replay the exact moment things broke, and suggests fixes based on the failing step. Teams use it to cut the time between "the output is wrong" and "here's the line that caused it."
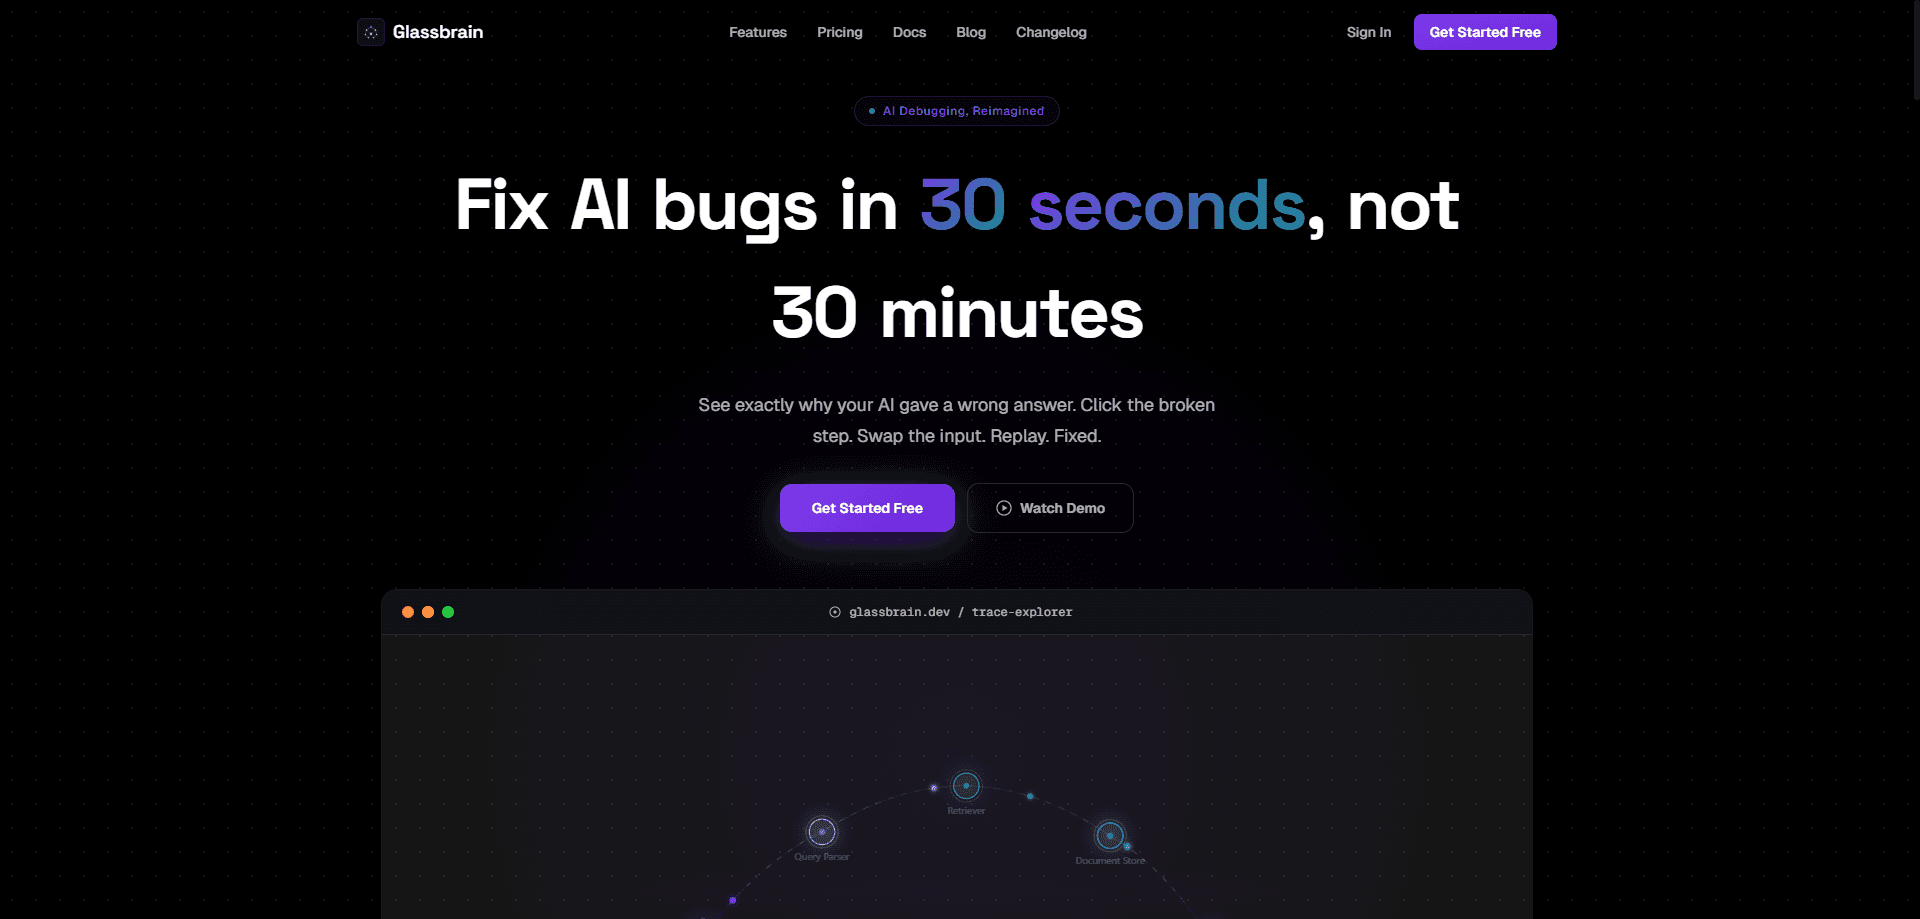
About Glassbrain
What Is Glassbrain
Glassbrain is a debugging workspace for AI applications. Instead of reading raw logs, you get a tree view of every step a request took: which prompt fired, which model answered, which tool call ran, and where the chain went sideways.
The problem it solves is simple. AI apps fail in ways normal debuggers handle badly. A wrong answer can come from a bad prompt, a stale context window, or a tool that returned junk, and logs alone rarely show which one of those three actually caused the failure you're staring at. Glassbrain keeps the whole run so you can walk back through it.
The catch is setup. This isn't a drop-in tool that works with zero code. You have to send your traces into it, which means wiring up an SDK or an integration first. If your stack doesn't match what it supports yet, expect some plumbing before you see anything useful, and budget an afternoon for that plumbing rather than ten minutes.
Getting Started
- Create an account on the Glassbrain site and open a new project for your app.
- Install the SDK or connect your existing tracing source with the project key.
- Run your app and trigger the AI feature you want to inspect.
- Open the trace tree for that run and click into the step that failed.
- Replay the run, review the suggested fix, then apply it in your code.
Product Information
A quick look at Glassbrain's pricing, supported platforms, and performance.
Best for
The users, tasks, and scenarios where this tool fits best.
Users
- Backend and ML engineers
- Solo developers shipping LLM apps
- Support and QA engineers
Tasks
- Tracing an AI request end to end
- Reproducing an intermittent AI failure
- Fixing a prompt or context bug
- Onboarding a new teammate to an AI codebase
Scenarios
- Debugging a chatbot that gives wrong answers
- Chasing a flaky agent that works sometimes
- Reviewing an AI feature before launch
Key features
Visual Trace Trees
Glassbrain lays out each AI run as a tree of steps. You see the full path a request took. Prompts, model calls, and tool results sit in order, and branches show where the logic split. For anyone who's ever scrolled through a wall of logs, this is the part that saves time.
Time-Travel Replay
You can step back to any point in a run and replay it from there. Why does that matter? Flaky AI bugs are the hardest kind. The ones that show up once out of twenty tries. Instead of trying to recreate the conditions, you reopen the run and watch what happened.
AI-Powered Fix Suggestions
Once a run fails, Glassbrain points at the likely cause and suggests a fix. The suggestion is a starting point, not a patch you apply blind. Treat it as a second opinion on the failing step. Then decide whether it matches your code. It won't always be right.
Run Capture and Storage
Every run is kept so you can return to it later. That helps when a bug is reported days after it happened, or when you need to compare a healthy run against a broken one. You don't have to have been watching live to debug it. That alone kills a lot of guesswork.
Web-Based Workspace
The whole thing runs in the browser. Nothing to install on your machine. You and a teammate can look at the same trace tree and point at the same step, which beats screen-sharing a terminal.
Pros and cons
Pros
- Trace trees make AI failures readable without digging through raw logs.
- Replay handles the flaky bugs that are hardest to reproduce by hand, the ones that vanish the moment you try to recreate them yourself.
- Fix suggestions give you a concrete starting point on the failing step.
- Runs are stored, so you can debug a report that arrived late.
Cons
- Requires SDK or integration setup before it does anything, so there's upfront work.
- Only useful if your app sends traces in; unsupported stacks see nothing.
- Fix suggestions still need a developer to judge them, since they don't know your full codebase.
Frequently asked questions
It's an AI debugging platform. It records each run of your AI feature as a trace tree, lets you replay it, and suggests fixes for the step that failed.
Related content
Explore related tools, skills, and articles for Glassbrain.
Glassbrain Alternatives
Forefront
Forefront · CodingForefront is a web platform for building with open-source AI. It lets you fine-tune leading open-source language models on your own data, evaluate how they perform, and run them through an API or export them to host yourself. Developers who want the convenience of a closed-source platform but insist on owning their models and data are the target audience here.

Startkit
StartKit.AI · CodingStartkit is a boilerplate for building AI SaaS and AI wrapper products. Think of it as an AI startup boilerplate with the boring parts already wired up: authentication, Stripe and Lemon Squeezy payments, usage limits, transactional email, and an AI API starter that talks to OpenAI, Anthropic, Groq, or Llama. You clone the repo, set your price, and start on the part of your product that people actually pay for. It's Next.js under React and Tailwind, so most of the boilerplate code already feels familiar.
Testim
Tricentis · CodingTestim is an AI-powered test automation platform for building and running end-to-end tests across web, mobile, and Salesforce applications. It leans on machine learning to keep tests stable when an interface changes, so teams spend less time fixing broken selectors. Not bad for an automated testing tool you can start using today. You create tests by recording actions in a browser, then optionally add JavaScript when you need more control. It's a solid pick for busy QA teams.