

Heron
Netis · Coding
Heron is an open-source agent observability tool that rebuilds AI agent turns and LLM API traffic from network packets instead of from your code. It reads a .pcap file, a live interface, or an eBPF probe and shows every planner step, tool call, and model response in a local dashboard. There's no SDK to install, no proxy to route through, and no cooperation needed from the applications you're watching. Want to know where the seconds and the errors actually go? Heron is built for exactly that. It suits LLM API monitoring on hosts you'd rather not instrument.
About Heron
What Is Heron
Heron is a passive observability tool for AI agents. It captures plaintext HTTP traffic and reconstructs what happened at the agent level, so you see complete turns (planner → tool → result → next step) rather than a pile of raw requests. The vendor, Netis, calls it "the Wireshark for AI agents," and that comparison holds up: you point it at traffic and it tells you what the traffic means. Simple as that.
The core idea is zero intrusion. Most monitoring tools make you add a library, wrap a client, or route calls through a gateway. Heron sits off to the side and reads the wire instead. That matters when the workload is a closed binary you can't rebuild, or when you don't want instrumentation code anywhere near production.
The tradeoff is the same one packet tools always have. Heron sees plaintext HTTP, so it needs to run where the traffic is already decrypted: on the inference host, behind the TLS terminator, or fed from a packet source you trust. Point it at encrypted traffic and it sees nothing useful. That's the catch.
Getting Started
- Install the single binary with the one-line installer, either system-wide or as a user-local install that needs no sudo.
- Give it packet access. On Linux that means granting capture capabilities once, or feeding it a .pcap file if you'd rather not touch live traffic.
- Run it against your source, for example
heron -i eth0on Linux orheron --pcap-file capture.pcapto replay a saved file. - Open the local console on port 3000 to browse agent turns, timelines, and metrics.
- Export any turn or full session as OpenAI-style messages JSONL if you want fine-tuning data.
Product Information
A quick look at Heron's pricing, supported platforms, and performance.
Best for
The users, tasks, and scenarios where this tool fits best.
Users
- Platform and SRE engineers who run inference fleets and need latency and error visibility without touching application code.
- AI teams debugging agent workflows, especially when the agent is a closed binary they can't instrument.
- Developers who want to build fine-tuning datasets from real agent traffic rather than synthetic examples.
Tasks
- Replaying a saved .pcap to reconstruct exactly what an agent did during a failed run.
- Watching live time-to-first-token, latency, throughput, and error rate per agent kind and model.
- Mapping an inference topology (clients → proxies → backends) to see which components handle which traffic.
- Exporting agent sessions as JSONL for supervised fine-tuning.
Scenarios
- A production inference host where you can't justify adding SDK calls to the request path.
- Post-incident review, where you have a packet capture but no application logs.
- Auditing what an autonomous agent actually called, and in what order, after a surprising outcome.
- Standing up monitoring in a lab or CI run using the bundled test .pcap fixtures.
Key features
Zero-Intrusion Capture
Heron reads traffic off the wire, at the host's TLS boundary, or through an experimental eBPF probe that catches plaintext at the SSL read/write boundary. No SDK, no proxy, no code changes, and no cooperation from the workload being observed. For teams with closed binaries or strict change controls, this removes the main reason agent monitoring gets postponed.
Agent Turn Reconstruction
Raw HTTP calls are hard to reason about. Heron stitches multi-call interactions into single addressable turns, so a planner step, its tool call, the tool result, and the follow-up call read as one narrative. You get the agent story, not a log of disconnected requests. That's the difference. It's the feature that separates it from generic API monitors.
Live Metrics Dashboard
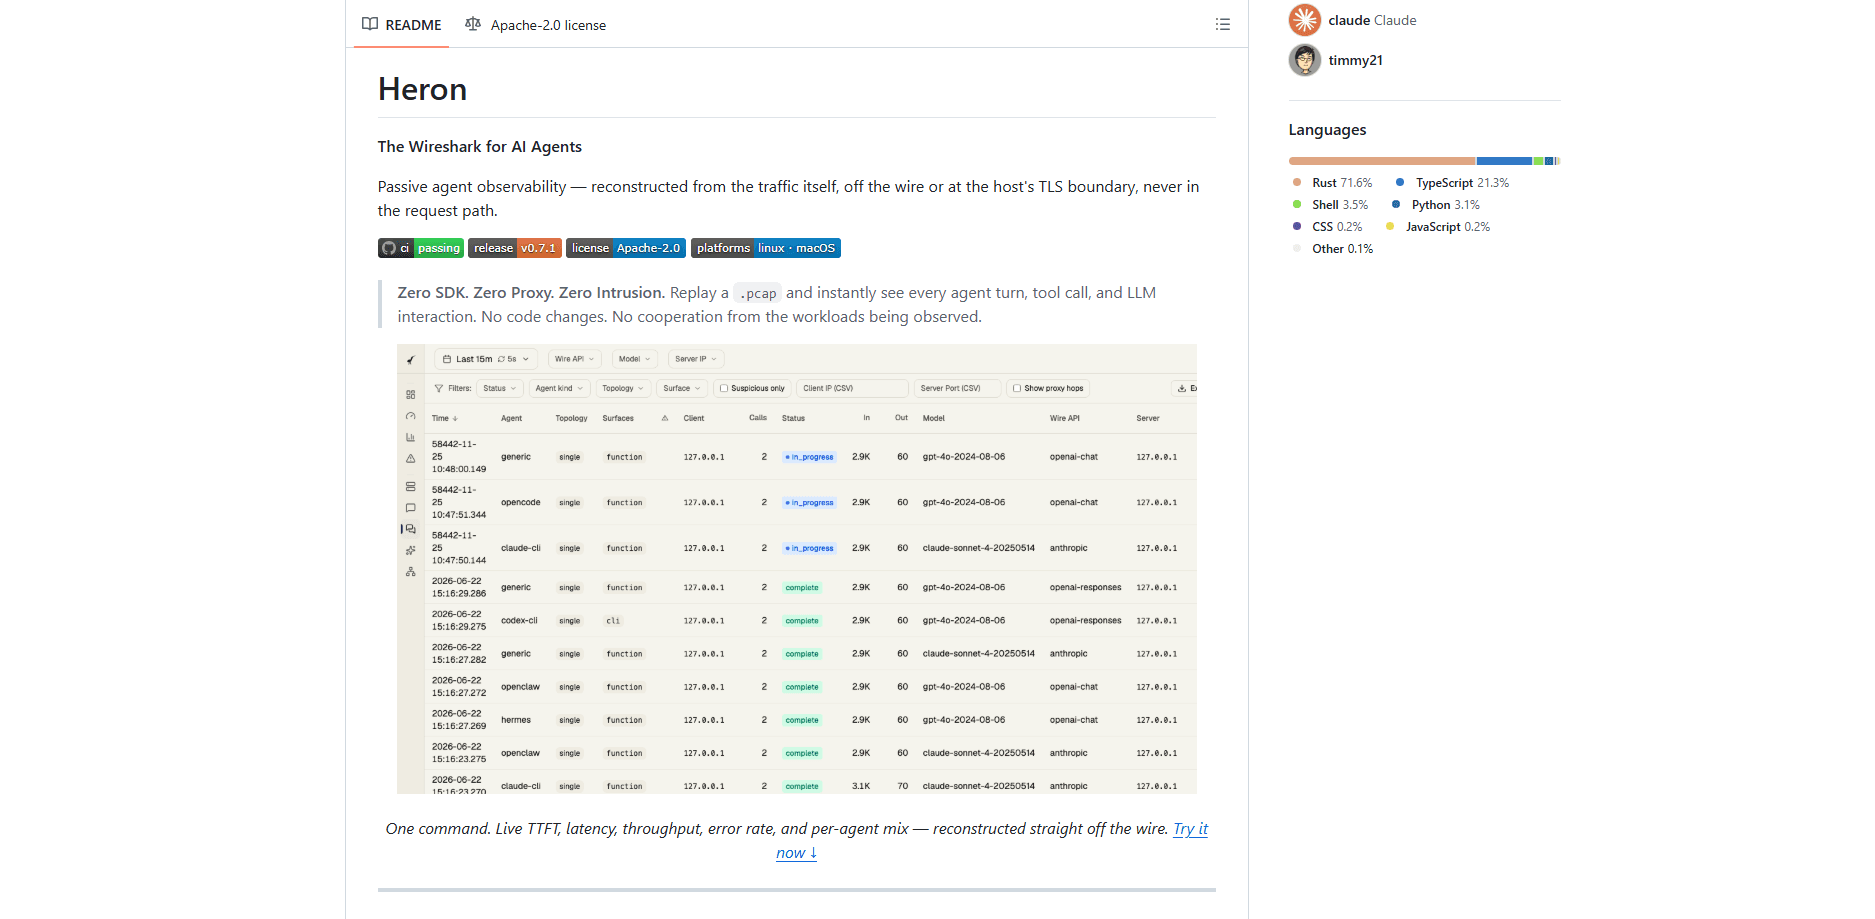
One command gives you live time-to-first-token, latency, throughput, error rate, and a per-agent mix, all reconstructed from traffic and shown in a local web console. Named profiles ship for Claude Code and OpenAI Codex CLI, with a generic profile for everything else. If you've ever wanted fleet-level numbers without a metrics pipeline, this is the shortcut. No pipeline required.
Service Classification and Topology
Heron figures out what each endpoint serves, such as vLLM, SGLang, Ollama, llama.cpp, or LiteLLM, by inspecting the bytes on the wire rather than reading a config file. It then renders your inference fleet as a directed graph, with edge thickness scaled by turn count. Misconfigured routing shows up fast when you can see it as a picture.
Fine-Tuning Data Export
Any turn or session exports as OpenAI-style messages JSONL, with tool calls, results, and reasoning preserved and arguments rehydrated into objects. Export a single turn from its detail view or batch-export from the turns list using the current filter. It turns real production traffic into training data you'd otherwise have to hand-label.
Pcap Replay Without Privileges
No live capture needed. Hand Heron a .pcap with LLM traffic and it replays the whole thing without special privileges, keeping the console open afterward so you can browse. The repo ships fixtures you can try before you touch any real system. That makes evaluation cheap. And safe.
Pros and cons
Pros
- Genuinely zero-intrusion: no SDK, proxy, or code changes, so it works on binaries you can't rebuild.
- Reconstructs agent-level turns instead of dumping raw HTTP, which is what you actually need for debugging.
- Single static binary with the web console embedded, so there's no installer or package-manager footprint.
- Pcap replay and bundled fixtures let you evaluate it with no privileges and no production risk.
- Fine-tuning JSONL export turns real traffic into training data with tool calls and reasoning intact.
Cons
- It only sees plaintext HTTP, so it has to run where TLS is already terminated. Point it at encrypted traffic and you get nothing.
- The eBPF capture path is experimental, Linux-only, and needs CAP_BPF, so it isn't a set-and-forget option yet.
- Live capture on Linux requires granting packet capabilities, which some security teams will want to review first.
Frequently asked questions
It captures network traffic and rebuilds AI agent turns and LLM API interactions from it. Instead of instrumenting your code, you run Heron where the traffic is visible and it reconstructs every planner step, tool call, and model response into a browsable dashboard.
Related content
Explore related tools, skills, and articles for Heron.
Heron Alternatives
Forefront
Forefront · CodingForefront is a web platform for building with open-source AI. It lets you fine-tune leading open-source language models on your own data, evaluate how they perform, and run them through an API or export them to host yourself. Developers who want the convenience of a closed-source platform but insist on owning their models and data are the target audience here.

Startkit
StartKit.AI · CodingStartkit is a boilerplate for building AI SaaS and AI wrapper products. Think of it as an AI startup boilerplate with the boring parts already wired up: authentication, Stripe and Lemon Squeezy payments, usage limits, transactional email, and an AI API starter that talks to OpenAI, Anthropic, Groq, or Llama. You clone the repo, set your price, and start on the part of your product that people actually pay for. It's Next.js under React and Tailwind, so most of the boilerplate code already feels familiar.
Testim
Tricentis · CodingTestim is an AI-powered test automation platform for building and running end-to-end tests across web, mobile, and Salesforce applications. It leans on machine learning to keep tests stable when an interface changes, so teams spend less time fixing broken selectors. Not bad for an automated testing tool you can start using today. You create tests by recording actions in a browser, then optionally add JavaScript when you need more control. It's a solid pick for busy QA teams.