

OpenBug
OpenBug (Revise Network) · Coding
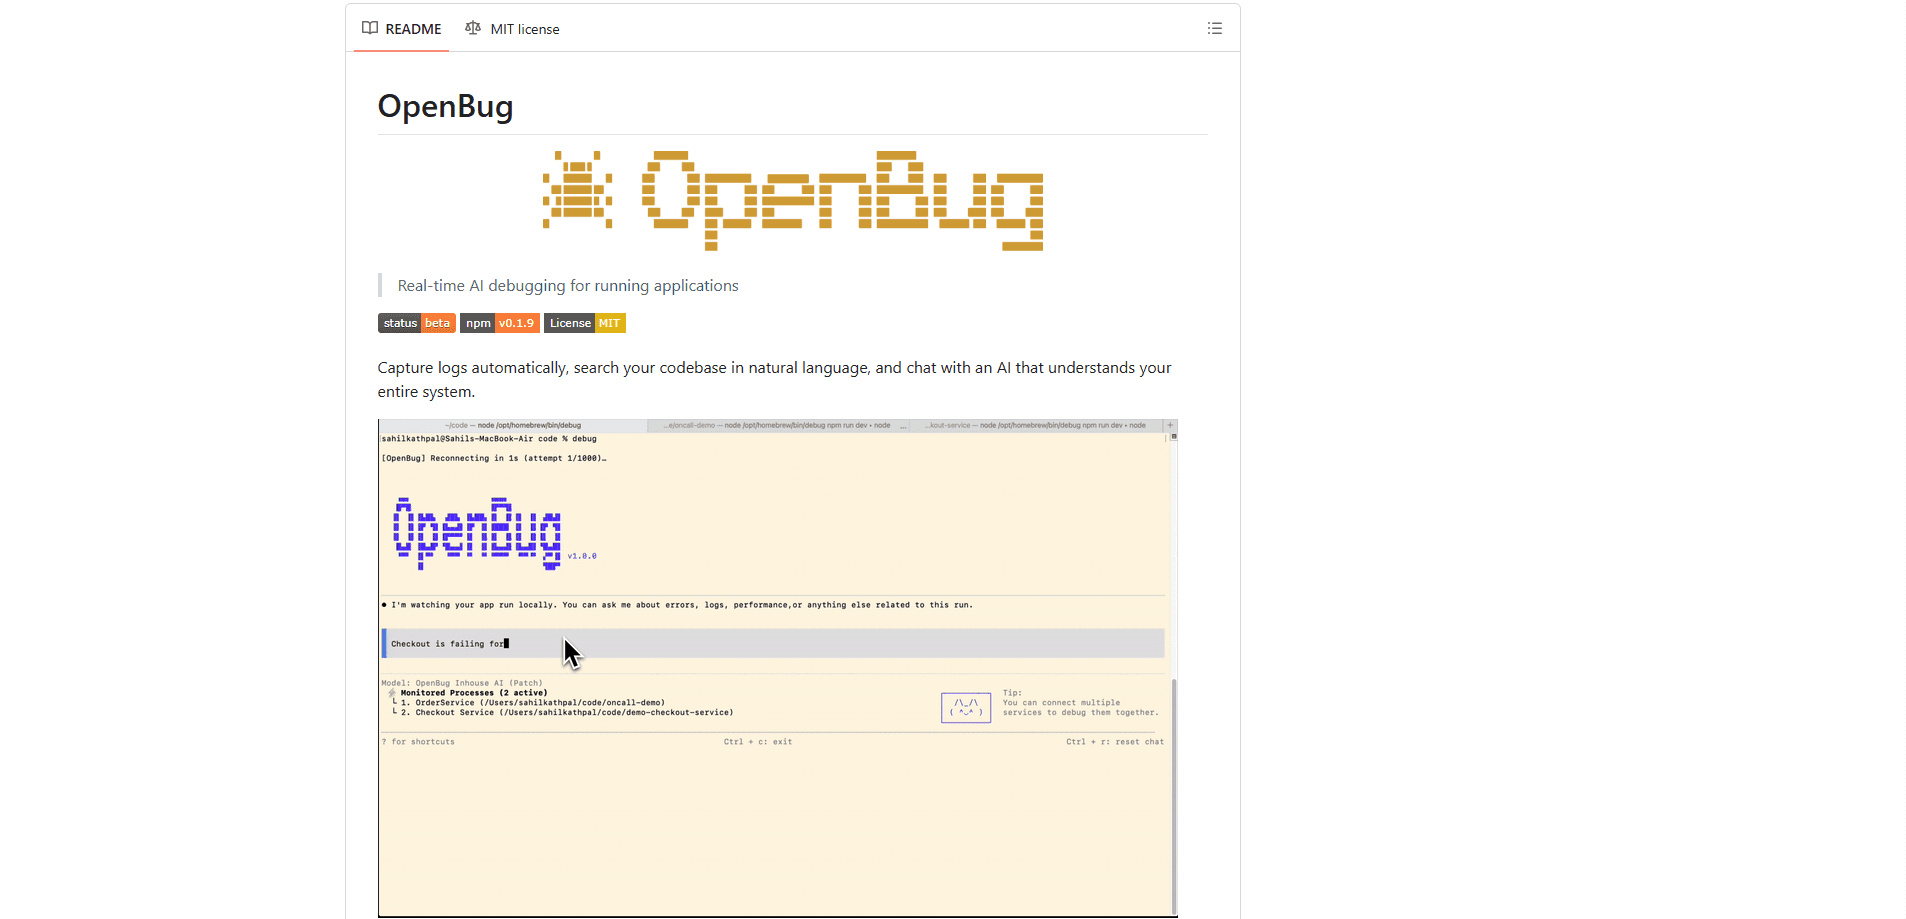
OpenBug is a command-line debugging tool that pairs your running app with an AI assistant. You wrap any command with `debug`, and this debug CLI streams logs from every connected service into one place while the AI reads relevant slices of your code. Runtime log analysis happens as the process runs, so nothing gets lost between a crash and your next question. Ask "why is the auth endpoint failing?" in plain English and you get an answer grounded in real logs, not generic guesses. It's built for developers who are tired of switching between terminals, grepping through log files, and pasting snippets into a separate chatbot.
About OpenBug
What Is OpenBug
OpenBug is an AI debugging tool that sits between your code and a chat assistant. Think of it as a command line debugger that also talks back. Instead of reading logs by hand, you run your app through the OpenBug CLI, and the tool captures what the process actually prints while it runs. The AI then uses those logs, plus targeted reads of your local codebase, to explain failures and suggest fixes.
The problem it solves is context. Modern apps split across a frontend, a backend, workers, and microservices, and the answer to a bug usually lives in more than one of them. OpenBug keeps logs from all of those services in one session and lets you query across them. You can also search your code in natural language, like "where do we handle payment webhooks?", without knowing the exact file name.
It's worth being clear about the limits. OpenBug is in beta, so expect rough edges. It needs Node.js 20 or newer, and the AI reads your code locally only when a service is flagged with code_available: true. Pricing isn't published on the official sources I could reach. What about the interface? It works through a terminal and a browser UI, not a mobile app.
Getting Started
- Install the CLI globally with
npm install -g @openbug/cli, making sure Node.js 20 or later is on your machine. - Create an account and grab an API key from the dashboard at
app.oncall.build, then rundebug login <your-api-key>once to store it locally. - Start the assistant in one terminal by running
debug. - In a second terminal, launch your app through the debugger, for example
debug npm run devordebug python app.py. - Ask the assistant about what you're seeing, such as "show me logs from the last auth request", and it will pull from the captured output and your code.
Product Information
A quick look at OpenBug's pricing, supported platforms, and performance.
Best for
The users, tasks, and scenarios where this tool fits best.
Users
- Backend and full-stack developers
- Engineers joining an unfamiliar codebase
- Small teams running several services
Tasks
- Diagnosing a failing endpoint
- Correlating errors across microservices
- Understanding payment or auth flows
- Replacing manual log grepping
Scenarios
- Debugging a dev server that crashes intermittently
- Onboarding onto a legacy repo
- Investigating a bug that spans the API and the frontend
Key features
Runtime log capture while the app runs
OpenBug captures the logs your app prints and makes them available to the AI in real time. You keep seeing the same output you'd normally see, but now it's queryable. That means you can ask about a failure as it happens. No waiting. No reconstructing it later from a saved file.
Natural language code search
You can search your codebase in ordinary English rather than regex. Ask "where do we validate JWT tokens?" and the assistant searches your actual code, not the internet. For anyone new to a project, this cuts out a lot of guessing about where a given behavior lives. It's fast, too.
Multi-service debugging
Logs from every service you've registered in the same project flow into one session. The AI can see the frontend, the backend, and any workers at once, so it can pick the right service to inspect and trace an issue across them. No more opening five terminals to compare log lines. That alone saves real time.
Local code inspection you control
The AI reads targeted slices of your code locally, and only when a service is marked code_available: true. Logs are gated the same way with logs_available. That keeps the scope of what the assistant can see tied to how you configure each service.
Two ways to interact, terminal and browser
You work from either a terminal UI or a browser UI. Keyboard shortcuts keep both quick, with Ctrl+D toggling between chat and logs in the terminal, and the browser view offering a fuller trimmed history. Pick whichever fits how you're working that day.
Project setup that remembers itself
The first time you run debug <command> in a directory, OpenBug prompts for a project description and writes an openbug.yaml file. After that it reuses the config automatically. Set it up once. It just works on every run after that.
Self-hosting option
If you'd rather not send data through the hosted service, you can run your own OpenBug server from the open-source repo, point the CLI at it with environment variables, and supply your own OpenAI API key. It's a real option for teams with stricter data rules.
Pros and cons
Pros
- Answers are grounded in live runtime logs plus your actual code, so they're more specific than a generic chatbot reply.
- Multi-service log correlation removes the manual work of comparing output across terminals.
- Natural language code search is genuinely useful when you're new to a repository.
- Local code access is gated by per-service flags, so you decide how much the AI can read.
- The CLI is open source and self-hostable, with an MIT license on the repository.
Cons
- It's in beta, so expect bugs and missing polish.
- Pricing isn't published on the official sources, which makes it hard to judge cost before committing.
- It requires Node.js 20 or newer, so older environments need an upgrade first.
- No mobile app and no Google Play download; it's a desktop terminal and browser tool.
Frequently asked questions
It's an AI debugging tool that captures your app's runtime logs and connects them to an assistant that can also read your code. You run your program through the debug command and then ask questions about what's going wrong, getting answers based on real output rather than guesses.
Related content
Explore related tools, skills, and articles for OpenBug.
OpenBug Alternatives
Forefront
Forefront · CodingForefront is a web platform for building with open-source AI. It lets you fine-tune leading open-source language models on your own data, evaluate how they perform, and run them through an API or export them to host yourself. Developers who want the convenience of a closed-source platform but insist on owning their models and data are the target audience here.

Startkit
StartKit.AI · CodingStartkit is a boilerplate for building AI SaaS and AI wrapper products. Think of it as an AI startup boilerplate with the boring parts already wired up: authentication, Stripe and Lemon Squeezy payments, usage limits, transactional email, and an AI API starter that talks to OpenAI, Anthropic, Groq, or Llama. You clone the repo, set your price, and start on the part of your product that people actually pay for. It's Next.js under React and Tailwind, so most of the boilerplate code already feels familiar.
Testim
Tricentis · CodingTestim is an AI-powered test automation platform for building and running end-to-end tests across web, mobile, and Salesforce applications. It leans on machine learning to keep tests stable when an interface changes, so teams spend less time fixing broken selectors. Not bad for an automated testing tool you can start using today. You create tests by recording actions in a browser, then optionally add JavaScript when you need more control. It's a solid pick for busy QA teams.