

OptiX AI
OptiX AI · Marketing
OptiX AI is an AI-powered analytics and reporting platform that unifies omnichannel marketing data into interactive dashboards with real-time insights and customizable visuals.
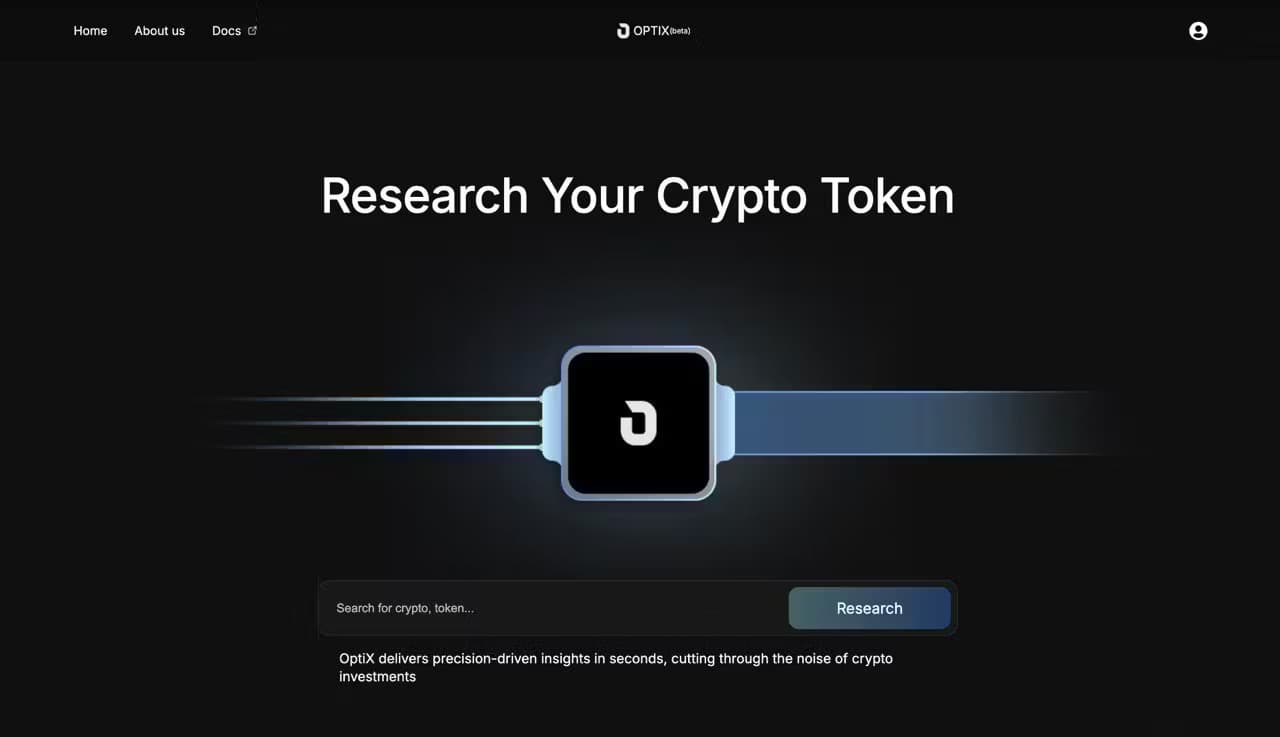
About OptiX AI
What Is OptiX AI
OptiX AI is an analytics and reporting platform for marketing teams that keep their data spread across channels. It pulls that data into one place and turns it into interactive marketing analytics dashboards, so a marketer reads a single view instead of stitching together exports from four tools.
The problem it targets is familiar. Ad spend, email, social and site traffic each live in their own console, and the person who has to report on all of it spends Monday copying numbers into a slide. OptiX AI works on the idea that the dashboard should update itself and answer a question in plain terms rather than wait for someone to build the chart.
The main limit is scope. This is a reporting layer, not a channel tool. It reads the data you connect and visualizes it, but it doesn't run your campaigns or fix a broken tracking setup for you. Teams with messy source data will need to clean that up first.
Getting Started
- Create an account and open the dashboard workspace for your team.
- Connect the marketing channels you report on, such as ad platforms, email, social and web analytics.
- Let the platform pull the data and map your key metrics, then confirm the fields it picked.
- Build a dashboard from the visualization tools, or start from a template and adjust the widgets.
- Share the view with your team or schedule it to refresh and send on a set cadence.
Product Information
A quick look at OptiX AI's pricing, supported platforms, and performance.
Best for
The users, tasks, and scenarios where this tool fits best.
Users
- Marketing managers who report to leadership
- Performance and growth marketers
- Small agency teams
- Analysts without a data team
Tasks
- Omnichannel reporting
- Real-time monitoring
- Metric tracking
- Custom visualization
- Stakeholder sharing
Scenarios
- The monthly report is due
- A campaign is running live
- An agency handles several clients
- A channel changes its metrics
Key features
Omnichannel Data Unification
OptiX AI connects marketing data from more than one source and brings it into a single workspace. Instead of logging into each ad platform, email tool and analytics console, you look at one dashboard that spans them. That matters most for teams whose reporting job is mostly reconciliation, where the real work is making sure five tools agree on the same number.
Interactive Dashboards
The dashboards are built to be clicked, not just read. You filter by date, channel or segment and the view updates in place, so a follow-up question doesn't need a new chart. This is the part that separates a live dashboard from a shared spreadsheet, where any change means someone rebuilds a tab.
Real-Time Insights
The platform surfaces insights as the data arrives rather than after a batch job runs. For teams watching live spend or a launch, that means seeing a problem while there's still time to act on it, not the next morning when the budget is already spent.
Customizable Visualization Tools
Charts, widgets and layouts are configurable, so you shape the dashboard around the questions your team asks instead of the defaults the tool ships with. You can keep a lean view for a leadership update and a denser one for the people working the numbers day to day.
Reporting and Sharing
Reports can be shared or scheduled, so a stakeholder gets the current view without asking for it. That turns reporting from a recurring task into a setting, which is the point for anyone who has spent a Friday afternoon on a slide deck.
AI-Powered Analysis
The AI layer sits over the connected data and helps make sense of it, which is the reason a reporting tool needs AI at all. The value isn't a chatbot bolted on top. It's taking a broad data set and pointing at what changed, so a marketer starts from a finding instead of a blank canvas.
Pros and cons
Pros
- Brings marketing data from several channels into one dashboard, so reporting doesn't mean stitching exports together
- Dashboards are interactive, so a follow-up question is a filter change rather than a new chart
- Real-time insights let teams catch a performance dip while they can still act on it
- Visualization tools are customizable, so the view fits the team instead of the other way around
- Reports can be shared on a schedule, which removes the recurring manual update
Cons
- It's a reporting layer, so it doesn't run campaigns or repair broken tracking on your side
- Teams with inconsistent source data have to sort that out before the dashboards are reliable
- Pricing, free plan and API details aren't published on the official product listing, so you have to confirm terms directly
- The official site is thin on public documentation, which makes evaluating the tool harder before you sign up
Frequently asked questions
OptiX AI is an AI-powered analytics and reporting platform. It unifies omnichannel marketing data into interactive dashboards and adds real-time insights plus customizable visualization tools, so teams can follow performance across channels from one place.
Related content
Explore related tools, skills, and articles for OptiX AI.
OptiX AI Alternatives

Tractionwave
TractionWave · Image · MarketingTractionWave is an AI attention heatmap tool for static ads. Upload a PNG or JPG and it returns predicted attention, ranked hotspots, and fixes before you spend budget.

OpenSEO - AI Visibility
EveryApp · Coding · Marketing · BusinessOpenSEO is an open source SEO platform for keyword research, backlinks, rank tracking, site audits, and AI visibility, with usage-based pricing and MCP access for AI agents.

Plugins Radar
Plugins Radar · Marketing · BusinessPlugins Radar tracks where your ChatGPT plugin ranks in directory and in-chat search, which competitors outrank it and what changed, with hourly checks on 9,885 listings.