

Picdoc
Picdoc · Image · Productivity
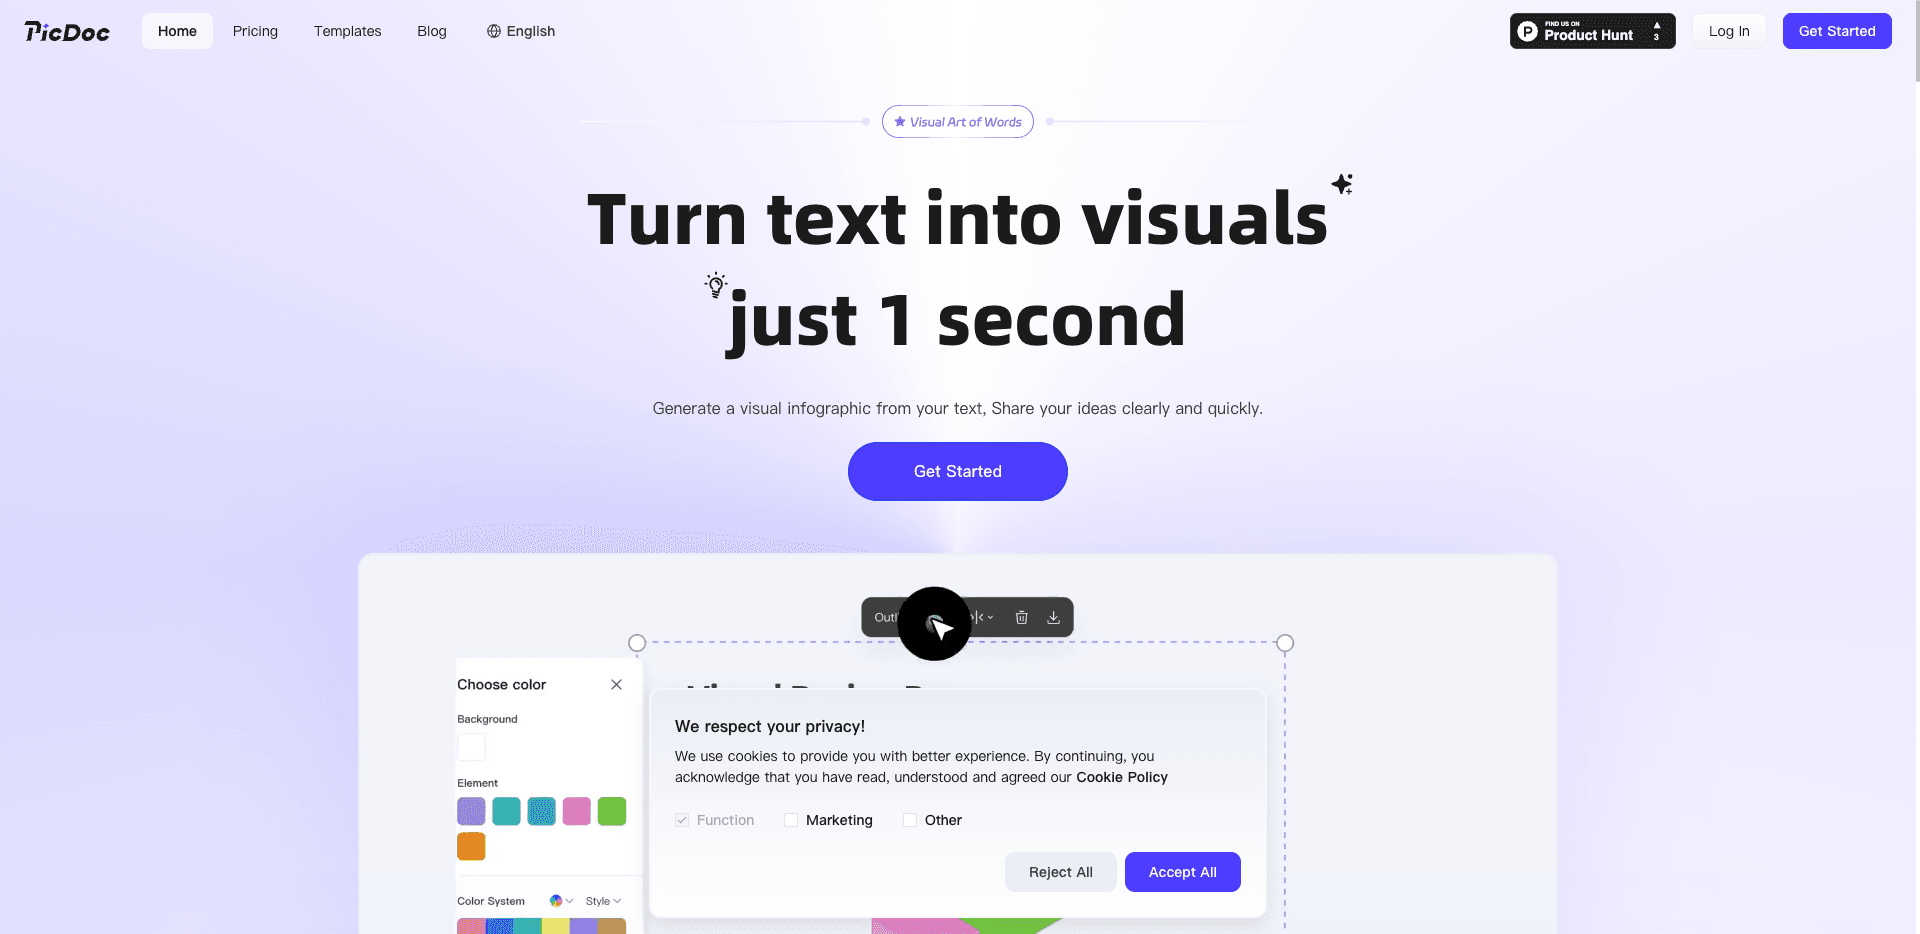
Picdoc is an AI text to visual tool that works as a text to infographic converter, an AI infographic generator, and an AI flowchart maker in one place. You paste text, select a section, and the tool reads the meaning behind it, then builds a visual that fits the relationship in your words. Think of it as a text to chart converter for people who can't draw. It fits writers, students, marketers, and anyone who needs a clear picture but has no design skills. Output goes out as PNG, JPG, PDF, or PPT, so it drops straight into a doc or slideshow.
About Picdoc
What Is Picdoc
Picdoc converts text into visuals. Its pitch is speed: the site claims it can generate a visual infographic from your text in about one second. Instead of building a diagram cell by cell, you give it raw text and it decides whether your content looks like a flow, a comparison, or a set of parallel points.
The tool has two sides. One is automatic: pick text, click generate, and let the AI choose a structure and a color scheme. The other is manual: you can adjust colors, fonts, layout, and icons, and keep a version you liked. That balance matters because pure auto-generation rarely lands the exact look a brand needs, and a chart that fights your color palette is worse than no chart at all when it's headed into a client deck. If you're putting a chart into a client deck, the second side is the one you'll live in.
The main limit is credits. Generation runs on a credit budget, and how many you burn depends on how much text you feed in and how long the result is. Longer input costs more. Article generation is free of credits right now. Image generation isn't.
Getting Started
- Sign up at the Picdoc website with an email or an account login.
- Type your own text, let the AI draft it from a theme, or upload a file to pull the text out.
- Highlight the paragraph or list you want to turn into a visual.
- Click the generate button next to the selection and pick from the structures the AI suggests.
- Tweak colors, fonts, and icons, then export as an image, a document, or a share link.
Product Information
A quick look at Picdoc's pricing, supported platforms, and performance.
Best for
The users, tasks, and scenarios where this tool fits best.
Users
- Content creators who write long pieces and want visuals to break them up, without opening a design app.
- Students and teachers turning dense notes or lesson points into diagrams that are easier to review.
- Marketers and sales staff who need a chart for a deck fast, and can live with a credit limit.
- Teams working across languages, since the tool generates in more than one language.
Tasks
- Turning a written process into a flowchart, such as mapping an approval chain or a signup flow.
- Converting a list of points into an infographic for a blog post or social page.
- Building a comparison chart from two sets of facts you already wrote down.
- Making a reusable visual template you update as the underlying numbers change.
Scenarios
- Prepping a client meeting the night before and needing a clean chart, not a rough sketch.
- Writing technical docs and adding a diagram so the steps are easier to follow.
- Brainstorming with a theme and watching the AI suggest text and image structures to spark ideas.
- Keeping a running board of daily notes that turns into a visual reference over time.
Key features
One-Click Text to Chart
You highlight text and click generate. Picdoc reads the content and picks a structure that matches it, whether that's a step-by-step flow, a side-by-side comparison, or a group of parallel items. The tool names flow diagrams, fishbone diagrams, bar charts, radar charts, and structural diagrams among the forms it can build. That's a wide net. The point is that you never touch a canvas tool.
AI Writing Assistance
If you don't have text ready, you can hand Picdoc a theme and let it draft content for you. This is useful in a brainstorm, where the goal is to get something on the screen and react to it. Ever stared at a blank slide at 11 p.m. before a morning review? The drafted text then feeds straight into chart generation, so the whole loop stays in one place.
Custom Editing and Styling
Every generated visual can be adjusted. You change item counts through an outline view, swap color sets for a whole board, and let the tool match icons automatically. Style switches cover flat, cartoon, and 3D looks, so the same data can read as playful or serious depending on the audience. One click changes the whole mood. That's the part I'd use most.
Export and Sharing
Finished work comes out as PNG, JPG, PDF, or PPT, which covers most doc and slide needs. PDF exports keep the chart in an editable state, so you can revisit it later. Share links can carry access settings, so a teammate can open the board and comment without you sending a file. No file juggling. That's a quiet win for weekly reporting.
Multi-Language Generation
The tool generates in more than one language, which helps teams that write and present in different tongues. One user on the site's testimonial wall, an entrepreneur, said the multi-language feature was the reason it worked for their international team, since everyone could read the same board without waiting on a translation pass. For solo users this matters less, but for cross-border teams it removes a translation step.
Whiteboard for Team Work
Picdoc doubles as a shared doc space. Teams can mark up a document and generate images from it in the same view, which shortens the gap between discussing an idea and showing it. This is the feature that pushes it past a plain chart generator for groups that work in the same file.
Pros and cons
Pros
- Turns text into a visual in about a second, so it fits fast-moving work where a rough chart beats no chart.
- No design background needed, since the AI picks the structure and the styling.
- Free tier exists and lets you try the core loop before paying anything.
- Exports cover PNG, JPG, PDF, and PPT, which matches the tools most people already use.
- Free-tier images can be used for commercial purposes during the trial, according to the site's FAQ.
Cons
- Credits are the real ceiling. Image generation burns them, and long inputs burn more, so heavy users hit the wall quickly.
- After the free trial ends, images generated on the free plan can't be used commercially, which rules it out for some business work.
- Pricing on the site is shown per plan without a clear dollar figure up front, so you have to reach checkout to see the exact cost.
- Whether it offers a public API is unclear, so developers who want to wire it into their own workflow should check first.
Frequently asked questions
Picdoc turns text into visuals. You give it written content and it builds charts, flowcharts, infographics, and diagrams, then exports them for docs, slides, or sharing.
Related content
Explore related tools, skills, and articles for Picdoc.
Picdoc Alternatives

X Ray Interpreter
X-ray Interpreter · ImageX Ray Interpreter is a web-based AI radiology tool that turns X-rays, CT scans, MRI, ultrasound, and PET images into plain-language reports. You upload a scan, get a preliminary X-ray interpretation in moments, then ask follow-up questions if something needs explaining. It works as a second opinion and a learning aid, not as a medical diagnosis.

Aieasypic
AIEasyPic · ImageAIEasyPic is an AI image generator that turns plain text prompts into finished artwork in seconds. You can also train custom models on your own photos, swap faces in existing images, and create short video clips from text, all from a browser. It suits casual creators who want quick visuals and hobbyists who want to build a personal model without touching any code.

Chargen
Chargen · ImageChargen is an AI character generator and worldbuilding toolkit built for Dungeons & Dragons and other tabletop RPGs. It turns a one-line idea into a painted character portrait, spins up NPCs, monsters, maps and encounters from the same session, and keeps every creature's details close at hand. The tabletop RPG art side runs on a credit system called Gold, while the text generators stay free for everyone.