Radar
Skyhook (KoalaOps, Inc.) · Coding
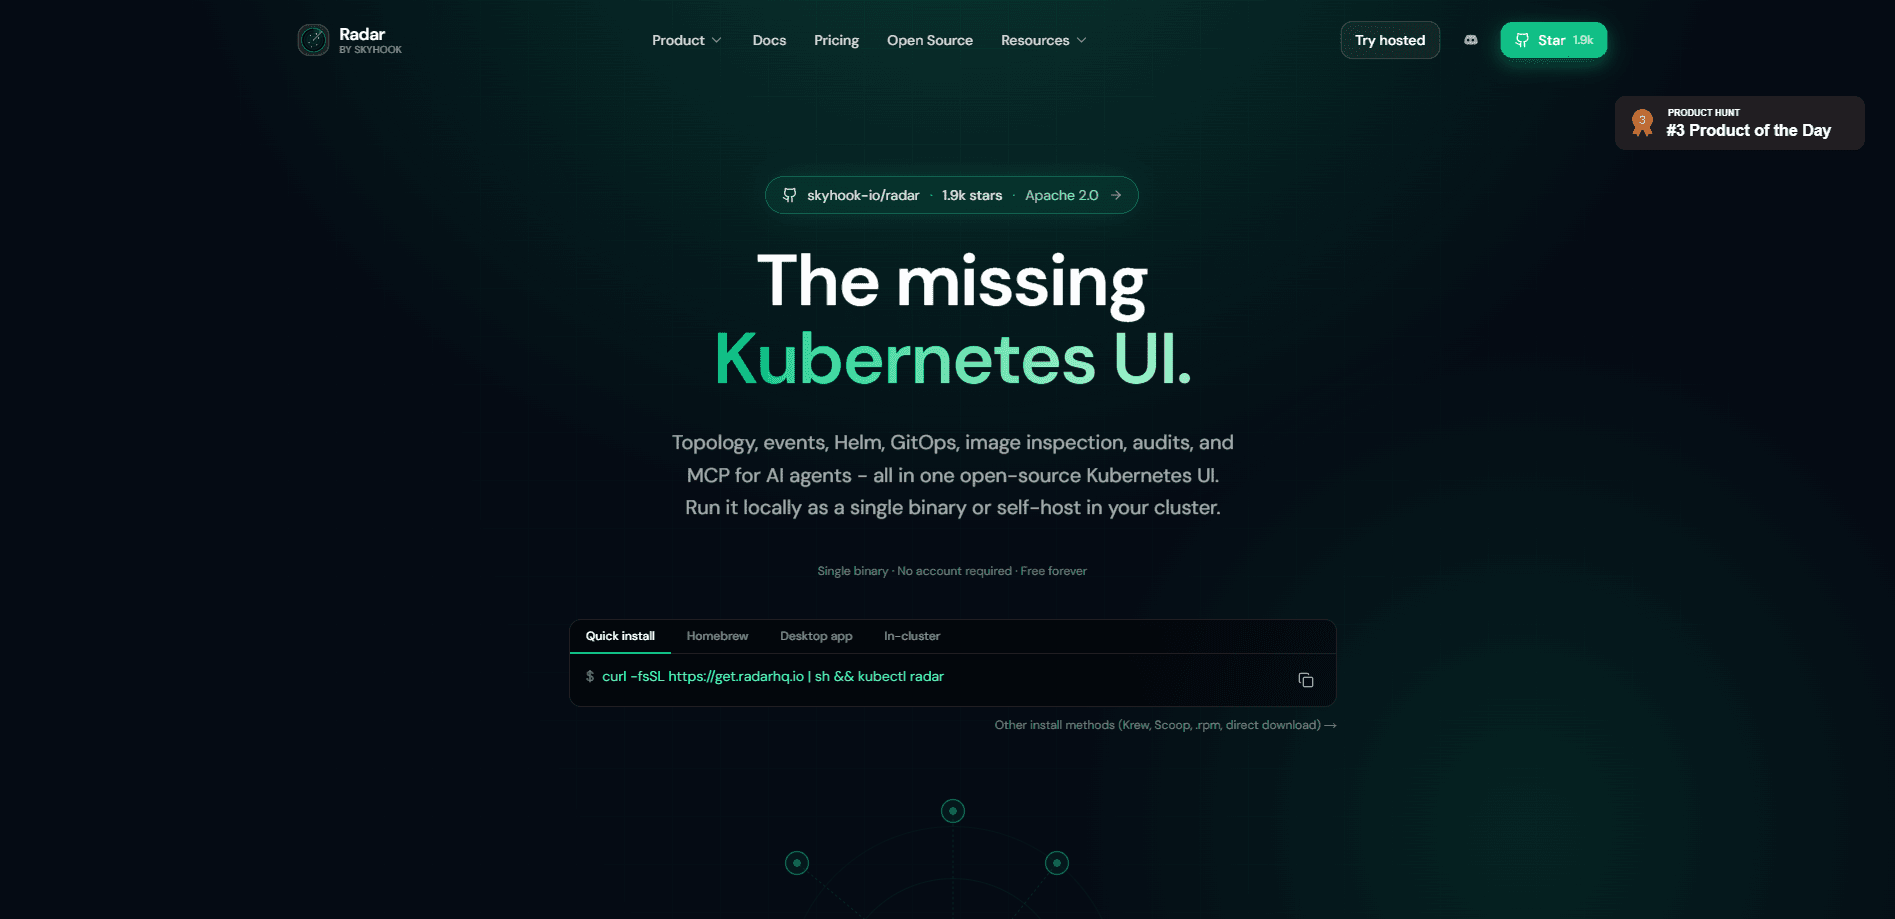
Radar is an open-source Kubernetes UI that turns live cluster state into answers instead of raw YAML. It folds failures to their root cause, groups workloads into the applications they form, and keeps every event past Kubernetes' default one-hour retention window. You can run the whole engine as a single binary on your laptop or in your cluster, and add a hosted layer only if your team needs fleet views and SSO. Most cluster visibility tools stop at listing resources. Radar starts from diagnosis, which is the part that actually saves time at 3 a.m. That's the whole pitch.
About Radar
What Is Radar
Radar is a visibility tool for Kubernetes, built by Skyhook (KoalaOps, Inc.) and licensed under Apache 2.0. As an open-source Kubernetes tool, it answers the questions platform and SRE teams ask during an incident: what's broken, why, and what changed. Instead of clicking through dozens of kubectl commands, you open one interface with topology, event timelines, Helm releases, GitOps sync state, image inspection, and a cluster audit that runs against cached state.
The product comes in two pieces. Radar OSS is the binary you run yourself, free and unlimited, with every documented feature included. Radar Cloud is an optional hosted control plane that adds a single URL across clusters, persistent retention, alerts, RBAC, and SSO. The same binary runs in each cluster in both cases. Cloud just dials out to a service your team shares. Simple enough.
The main limit is scope. Radar is built for people who already operate Kubernetes, not for beginners learning it. It reads from your kubeconfig and speaks to the API server, so it needs the usual access permissions to show you anything useful. There's no mobile app. The OSS version also leaves long-term retention and team authentication to the Cloud tier, which means teams that want persistent history and centralized login will need to move to a paid plan.
Getting Started
- Download the Radar binary from the GitHub releases page or install it through your package manager, and run it locally against any cluster reachable from your kubeconfig.
- Open the local URL Radar prints, then point it at the context you want to inspect. Nothing gets installed inside the cluster for local use.
- Click through the nav rail to the view you need: Failures, Applications, Topology, Timeline, GitOps, or Audit.
- To connect AI agents, enable the MCP server and wire it into Claude Code, Codex, or Cursor so they query live cluster state.
- If your team wants shared views, sign up for Radar Cloud and install the Helm chart in each cluster to link them to the hosted plane.
Product Information
A quick look at Radar's pricing, supported platforms, and performance.
Best for
The users, tasks, and scenarios where this tool fits best.
Users
- Platform engineers
- SREs on call
- DevOps leads
Tasks
- Tracing why a workload went unhealthy
- Auditing a cluster's security and reliability posture
- Reviewing GitOps drift
Scenarios
- A deployment starts crash-looping and nobody knows what preceded it
- You inherit a cluster with no documentation
- You want an AI agent to triage a failing resource
Key features
Root-cause failure view
Radar classifies failures by subject and folds them into one row with a probable cause and the change that came before it. Each failure carries causal links and blast radius, so you can see whether a crash is the origin or a downstream effect. This is deterministic rather than a guess. That matters when you're deciding whether to roll back.
Live topology
Every resource and connection is laid out with ELK.js and pushed to the browser over server-sent events. You group the graph by namespace or label, so a messy microservice setup becomes readable at a glance. Because updates stream in, the view reflects the cluster as it changes. No polling delay.
Event timeline that outlives the default
Kubernetes forgets events after about an hour, which is exactly when you're usually still investigating. Radar captures every event and resource delta the moment it fires and holds them longer than the API server would. That means you can walk back through what happened before a failure even if it started a while ago. Ever restarted a pod and lost the evidence? Same problem.
GitOps visibility for ArgoCD and Flux
ArgoCD and Flux appear in a single view with sync state, field-level drift, and a diagnosis of why an app is OutOfSync or stuck. You don't have to bounce between two dashboards to find which controller is unhappy. Drift is shown field by field, so you know what changed and not just that something did. That's the useful part.
Built-in cluster audit
Radar ships 36 best-practice checks covering security, reliability, and efficiency. It runs them against cached state in under a second. That's a fast way to spot misconfigurations without wiring up a separate scanning tool. For deeper triage, it also inspects container image filesystems.
MCP server for AI agents
Everything the views show, Radar also exposes over MCP. Your Kubernetes MCP server lets a coding agent like Claude Code, Codex, or Cursor query the live cluster through the same diagnosis engine, so it answers from real state instead of guessing at kubectl output. Diagnose flips this around. One click on a failing resource runs a read-only investigation and argues the root cause, with no API key or account needed.
Helm and resource management
The Helm release manager lists every release, revision, and values file, and lets you roll back, diff revisions, and view history without the helm CLI. The resource browser handles workloads, log streaming, pod exec, YAML edits, and port-forwarding, and it auto-discovers any CRD through informers that track custom resources as they appear.
Local-first, airgap-ready binary
Radar runs as a single binary with no sidecars, agents, or CRDs to install. It works on your laptop or in-cluster, and it's built to run in airgapped environments where nothing is allowed to phone home to an outside service. When features like Hubble, OpenCost, or Istio traffic are present, Radar picks them up automatically. It leaves them off when it can't find them.
Pros and cons
Pros
- The full engine is Apache 2.0 and free, with no features held back to push you onto the paid tier. Nothing is gated.
- Per-cluster pricing avoids the per-seat cost that punishes teams for sharing dashboards widely.
- Failures arrive pre-correlated with probable cause and causal links, so you skip the manual kubectl detective work.
- Runs as one binary with nothing installed in the cluster, which suits airgapped and locked-down environments.
- MCP access lets AI agents read real cluster state without an API key.
Cons
- It assumes you already know Kubernetes, so newcomers will find the terminology dense.
- Radar OSS leaves persistent retention and team SSO to the Cloud tier, so those need a paid plan.
- There's no dedicated mobile app; the interface is meant for a desktop browser or terminal workflow.
- The free Cloud tier caps you at three connected clusters, which can bite a growing team.
Frequently asked questions
Radar is a Kubernetes UI for seeing what's broken, why it broke, and what changed. It bundles topology, event timelines, Helm, GitOps sync state, image inspection, cluster audits, and MCP access into one binary. You run it locally or in-cluster.
Related content
Explore related tools, skills, and articles for Radar.
Radar Alternatives
Forefront
Forefront · CodingForefront is a web platform for building with open-source AI. It lets you fine-tune leading open-source language models on your own data, evaluate how they perform, and run them through an API or export them to host yourself. Developers who want the convenience of a closed-source platform but insist on owning their models and data are the target audience here.

Startkit
StartKit.AI · CodingStartkit is a boilerplate for building AI SaaS and AI wrapper products. Think of it as an AI startup boilerplate with the boring parts already wired up: authentication, Stripe and Lemon Squeezy payments, usage limits, transactional email, and an AI API starter that talks to OpenAI, Anthropic, Groq, or Llama. You clone the repo, set your price, and start on the part of your product that people actually pay for. It's Next.js under React and Tailwind, so most of the boilerplate code already feels familiar.
Testim
Tricentis · CodingTestim is an AI-powered test automation platform for building and running end-to-end tests across web, mobile, and Salesforce applications. It leans on machine learning to keep tests stable when an interface changes, so teams spend less time fixing broken selectors. Not bad for an automated testing tool you can start using today. You create tests by recording actions in a browser, then optionally add JavaScript when you need more control. It's a solid pick for busy QA teams.